GB Voting Intention (Week 6 2023)

In a new poll commissioned by GB News, we find a 29pt lead to Labour. The full tables are available here.

Selected media coverage

If there were to be a general election tomorrow, which party would you vote for?

Vote share (%)
Latest
Feb 9
Previous
Feb 1
Labour 50 46
Conservative 21 22
Lib Dem 7 9
Reform UK 7 7
Green 6 7
SNP 4 5
Other party 3 2
Plaid Cymru 1 2
Population sampled: All adults (18+) in Great Britain.
Sample sizes: 1229 (latest) and 1139 (previous).

If you had to choose, which Prime Minister has been the best since the 2019 general election?

Unweighted Weighted Boris Johnson Rishi Sunak Liz Truss Prefer not to say Don’t know Total
Overall
National 1229 1229 26% 15% 2% 21% 36% 100%
Gender
Female 646 637 23% 14% 2% 22% 39% 100%
Male 583 592 29% 17% 2% 20% 33% 100%
Age
18-24 149 130 12% 16% 2% 27% 43% 100%
25-49 523 507 20% 13% 3% 22% 42% 100%
50-64 303 302 33% 12% 2% 22% 31% 100%
65+ 254 291 33% 23% 1% 15% 29% 100%
SEG
AB 291 288 19% 26% 1% 18% 36% 100%
C1 376 381 23% 14% 2% 21% 39% 100%
C2 260 261 34% 11% 1% 22% 33% 100%
DE 302 299 28% 11% 3% 23% 35% 100%
Region
London 145 173 25% 16% 1% 20% 37% 100%
Midlands/Wales 379 330 28% 14% 2% 18% 38% 100%
North 320 334 24% 16% 0% 24% 35% 100%
Rest of South 280 286 28% 15% 3% 21% 34% 100%
Scotland 105 105 19% 17% 5% 23% 37% 100%
2019 General Election
Conservative Party 355 365 52% 18% 2% 8% 20% 100%
Labour Party 289 276 8% 18% 2% 25% 47% 100%
Liberal Democrats 97 102 10% 30% 1% 26% 33% 100%
2016 Brexit referendum
Leave 444 452 47% 11% 2% 15% 26% 100%
Remain 435 443 12% 23% 2% 26% 37% 100%

Under the triple lock, the state pension is supposed to increase each year in line with whichever is highest – inflation, average earnings or 2.5%. Do you believe this policy will still exist in five years?

Unweighted Weighted Yes No Prefer not to say Don’t know Total
Overall
National 1229 1229 11% 47% 9% 33% 100%
Gender
Female 646 637 7% 43% 12% 38% 100%
Male 583 592 15% 50% 6% 29% 100%
Age
18-24 149 130 12% 30% 25% 33% 100%
25-49 523 507 6% 48% 12% 34% 100%
50-64 303 302 11% 50% 5% 33% 100%
65+ 254 291 17% 48% 2% 33% 100%
SEG
AB 291 288 9% 54% 6% 31% 100%
C1 376 381 13% 45% 9% 34% 100%
C2 260 261 10% 42% 12% 36% 100%
DE 302 299 10% 46% 11% 33% 100%
Region
London 145 173 11% 49% 11% 29% 100%
Midlands/Wales 379 330 9% 48% 10% 33% 100%
North 320 334 13% 46% 9% 31% 100%
Rest of South 280 286 11% 44% 8% 37% 100%
Scotland 105 105 8% 46% 8% 38% 100%
2019 General Election
Conservative Party 355 365 16% 50% 4% 30% 100%
Labour Party 289 276 9% 56% 8% 27% 100%
Liberal Democrats 97 102 9% 48% 9% 35% 100%
2016 Brexit referendum
Leave 444 452 13% 52% 4% 31% 100%
Remain 435 443 9% 53% 7% 31% 100%

Which political party do you think would be the best at managing Brexit?

Unweighted Weighted Labour Conservative Lib Dem SNP Plaid Cymru Reform UK Green Prefer not to say Don’t know Total
Overall
National 1229 1229 17% 16% 5% 3% 1% 5% 2% 12% 40% 100%
Gender
Female 646 637 16% 12% 4% 2% 0% 4% 2% 15% 46% 100%
Male 583 592 18% 20% 6% 3% 1% 6% 3% 10% 33% 100%
Age
18-24 149 130 16% 6% 6% 3% 1% 2% 4% 23% 39% 100%
25-49 523 507 20% 6% 5% 3% 1% 3% 3% 14% 45% 100%
50-64 303 302 14% 20% 6% 3% 1% 7% 1% 9% 39% 100%
65+ 254 291 16% 31% 4% 0% 8% 2% 7% 31% 100%
SEG
AB 291 288 20% 17% 7% 3% 0% 3% 3% 10% 38% 100%
C1 376 381 19% 15% 4% 2% 0% 3% 2% 11% 43% 100%
C2 260 261 16% 18% 5% 3% 2% 6% 1% 13% 37% 100%
DE 302 299 14% 13% 4% 3% 0% 8% 3% 16% 39% 100%
Region
London 145 173 19% 19% 5% 1% 6% 1% 11% 38% 100%
Midlands/Wales 379 330 17% 15% 6% 1% 2% 6% 1% 12% 41% 100%
North 320 334 20% 15% 3% 1% 6% 3% 14% 38% 100%
Rest of South 280 286 14% 16% 7% 2% 1% 3% 5% 11% 41% 100%
Scotland 105 105 15% 11% 2% 15% 3% 15% 39% 100%
2019 General Election
Conservative Party 355 365 6% 41% 3% 1% 0% 11% 0% 6% 32% 100%
Labour Party 289 276 45% 1% 3% 3% 1% 1% 4% 10% 32% 100%
Liberal Democrats 97 102 13% 4% 28% 2% 5% 14% 34% 100%
2016 Brexit referendum
Leave 444 452 13% 30% 2% 1% 0% 11% 1% 9% 33% 100%
Remain 435 443 25% 8% 9% 4% 1% 1% 4% 11% 36% 100%

How satisfied are you with King Charles III in his first 150 days as king?

Unweighted Weighted Completely satisfied Somewhat satisfied Somewhat dissatisfied Completely dissatisfied Prefer not to say Don’t know Total
Overall
National 1229 1229 26% 18% 4% 7% 11% 34% 100%
Gender
Female 646 637 25% 18% 4% 6% 12% 35% 100%
Male 583 592 27% 19% 4% 7% 10% 32% 100%
Age
18-24 149 130 8% 15% 8% 8% 20% 41% 100%
25-49 523 507 19% 15% 4% 6% 13% 43% 100%
50-64 303 302 31% 18% 6% 7% 8% 30% 100%
65+ 254 291 41% 25% 2% 7% 6% 18% 100%
SEG
AB 291 288 28% 19% 5% 6% 8% 34% 100%
C1 376 381 26% 19% 2% 7% 11% 35% 100%
C2 260 261 26% 15% 6% 7% 12% 33% 100%
DE 302 299 23% 20% 5% 6% 13% 33% 100%
Region
London 145 173 24% 20% 4% 8% 11% 32% 100%
Midlands/Wales 379 330 28% 18% 2% 7% 11% 33% 100%
North 320 334 24% 20% 5% 4% 12% 35% 100%
Rest of South 280 286 27% 18% 6% 6% 11% 34% 100%
Scotland 105 105 25% 15% 4% 12% 10% 34% 100%
2019 General Election
Conservative Party 355 365 44% 20% 2% 6% 6% 22% 100%
Labour Party 289 276 16% 19% 5% 11% 8% 40% 100%
Liberal Democrats 97 102 23% 22% 1% 4% 17% 33% 100%
2016 Brexit referendum
Leave 444 452 35% 21% 3% 6% 8% 27% 100%
Remain 435 443 23% 20% 4% 8% 11% 35% 100%

Details

  • Client: GB News
  • Fieldwork Period: February 8-9, 2023
  • Sampling Method: Online
  • Population Sampled: All adults (18+) in Great Britain
  • Sample Size: 1,229
  • Data Collection: The data is acquired from a panel provider offering participants the chance to win money. The sampling relies on an online quota approach. Specifically, participants are sampled to meet Office of National Statistics quotas for gender, age, region, socio-economic group, vote in the 2019 general election, and vote in the 2016 Brexit referendum. No criteria are used to over- or undersample respondents. To ensure the polling is representative of the target population, we use official and reliable data sources to match the sample to demographic population targets.
  • Weighting: The sample has been weighted to be representative of the population on the following variables: gender, age, socio-economic group, region, vote in the 2019 General Elections and 2016 Brexit referendum vote.
  • Turnout Weighting for Voting Intention: To gauge the likelihood of a respondent voting in the General Elections, the poll used an 11-point scale to measure the certainty that the respondent would vote if there was an election tomorrow. The voting intention answers are then weighted by the likelihood to vote (by the numerical answer to the question divided by 10, e.g., a respondent providing a likelihood to vote of 8 out of 10 will have a weight of 0.8).
  • Margin of Error: All polls are subject to a wide range of potential sources of error. On the basis of the historical record of the polls at recent general elections, there is a 9 in 10 chance that the true value of a party’s support lies within 4 points of the estimates provided by this poll, and a 2 in 3 chance that they lie within 2 points.

The UK and the European Union Poll

In a new poll for Camilla Tominey Today on GB News, we found that just 4 per cent of the public think that the UK government got a “good deal” from the EU. The full tables are available here.

Selected media coverage

Did the UK make the right decision when we voted to leave the EU in 2016?

Unweighted Weighted Wrong decision Right decision Prefer not to say Don’t know Total
Overall
National 1126 1126 49% 30% 6% 15% 100%
Gender
Female 588 585 51% 24% 7% 18% 100%
Male 538 541 46% 37% 5% 12% 100%
Age
18-24 87 119 55% 19% 11% 15% 100%
25-49 508 464 55% 20% 8% 17% 100%
50-64 278 276 43% 38% 3% 15% 100%
65+ 253 266 40% 45% 2% 12% 100%
SEG
AB 266 268 64% 21% 5% 10% 100%
C1 339 332 54% 27% 4% 14% 100%
C2 231 236 36% 39% 8% 17% 100%
DE 290 290 38% 36% 7% 19% 100%
Region
London 129 159 56% 26% 5% 13% 100%
Midlands/Wales 350 302 42% 37% 6% 15% 100%
North 285 306 45% 31% 6% 18% 100%
Rest of South 269 262 50% 30% 6% 13% 100%
Scotland 93 96 64% 16% 5% 15% 100%
2019 General Election
Conservative Party 325 317 20% 63% 4% 13% 100%
Labour Party 258 261 79% 8% 4% 9% 100%
Liberal Democrats 87 87 89% 6% 6% 100%
2016 Brexit referendum
Leave 425 423 13% 69% 5% 14% 100%
Remain 409 406 86% 4% 3% 8% 100%

In your opinion, has Brexit made you richer or poorer?

Unweighted Weighted Richer About the same Poorer Prefer not to say Don’t know Total
Overall
National 1126 1126 2% 34% 45% 5% 14% 100%
Gender
Female 588 585 1% 28% 48% 6% 17% 100%
Male 538 541 3% 39% 42% 4% 12% 100%
Age
18-24 87 119 28% 43% 8% 20% 100%
25-49 508 464 2% 25% 50% 7% 16% 100%
50-64 278 276 3% 39% 41% 3% 13% 100%
65+ 253 266 2% 44% 41% 2% 10% 100%
SEG
AB 266 268 0% 29% 53% 5% 13% 100%
C1 339 332 1% 32% 51% 4% 13% 100%
C2 231 236 4% 38% 37% 6% 14% 100%
DE 290 290 3% 36% 38% 5% 17% 100%
Region
London 129 159 2% 32% 46% 4% 16% 100%
Midlands/Wales 350 302 2% 32% 43% 7% 16% 100%
North 285 306 3% 37% 42% 4% 14% 100%
Rest of South 269 262 2% 37% 45% 4% 13% 100%
Scotland 93 96 22% 61% 6% 11% 100%
2019 General Election
Conservative Party 325 317 4% 59% 20% 3% 14% 100%
Labour Party 258 261 0% 16% 72% 3% 9% 100%
Liberal Democrats 87 87 14% 71% 14% 100%
2016 Brexit referendum
Leave 425 423 5% 60% 19% 4% 12% 100%
Remain 409 406 15% 71% 3% 11% 100%

Did the UK government get a good deal or bad deal from the EU?

Unweighted Weighted A good deal A bad deal Prefer not to say Don’t know Total
Overall
National 1126 1126 4% 54% 6% 36% 100%
Gender
Female 588 585 4% 47% 7% 42% 100%
Male 538 541 5% 61% 5% 29% 100%
Age
18-24 87 119 4% 44% 11% 41% 100%
25-49 508 464 4% 51% 8% 38% 100%
50-64 278 276 5% 51% 4% 40% 100%
65+ 253 266 5% 65% 3% 27% 100%
SEG
AB 266 268 5% 58% 7% 30% 100%
C1 339 332 4% 58% 4% 34% 100%
C2 231 236 4% 53% 8% 34% 100%
DE 290 290 4% 44% 5% 46% 100%
Region
London 129 159 7% 54% 6% 32% 100%
Midlands/Wales 350 302 2% 51% 7% 39% 100%
North 285 306 5% 51% 5% 38% 100%
Rest of South 269 262 5% 58% 5% 33% 100%
Scotland 93 96 2% 56% 7% 35% 100%
2019 General Election
Conservative Party 325 317 7% 51% 3% 38% 100%
Labour Party 258 261 4% 68% 5% 24% 100%
Liberal Democrats 87 87 4% 66% 3% 28% 100%
2016 Brexit referendum
Leave 425 423 6% 53% 5% 36% 100%
Remain 409 406 4% 65% 5% 26% 100%

Details

  • Client: GB News
  • Fieldwork Period: February 2, 2023
  • Sampling Method: Online
  • Population Sampled: All adults (18+) in Great Britain
  • Sample Size: 1,126
  • Data Collection: The data is acquired from a panel provider offering participants the chance to win money. The sampling relies on an online quota approach. Specifically, participants are sampled to meet Office of National Statistics quotas for gender, age, region, socio-economic group, vote in the 2019 general election, and vote in the 2016 Brexit referendum. No criteria are used to over- or undersample respondents. To ensure the polling is representative of the target population, we use official and reliable data sources to match the sample to demographic population targets.
  • Weighting: The sample has been weighted to be representative of the population on the following variables: gender, age, socio-economic group, region, vote in the 2019 General Elections and 2016 Brexit referendum vote.

GB Voting Intention (Week 5 2023)

In a new poll commissioned by GB News, we find a 24pt lead to Labour. The full tables are available here.

Selected media coverage

If there were to be a general election tomorrow, which party would you vote for?

Vote share (%)
Latest
Feb 1
Previous
Jan 24
Labour 46 50
Conservative 22 21
Lib Dem 9 8
Reform UK 7 7
Green 7 5
SNP 5 6
Plaid Cymru 2 1
Other party 2 3
Population sampled: All adults (18+) in Great Britain.
Sample sizes: 1139 (latest) and 1270 (previous).

How confident are you that prime minister Rishi Sunak will take care of sleaze in British politics?

Unweighted Weighted Completely confident Fairly confident Somewhat confident Slightly confident Not confident at all Prefer not to say Don’t know Total
Overall
National 1139 1139 1% 6% 7% 8% 55% 8% 14% 100%
Gender
Female 590 590 1% 6% 6% 9% 51% 9% 19% 100%
Male 549 549 1% 7% 9% 7% 59% 6% 9% 100%
Age
18-24 82 121 8% 4% 4% 51% 21% 12% 100%
25-49 519 469 1% 3% 4% 7% 60% 9% 17% 100%
50-64 272 280 1% 8% 12% 7% 54% 4% 15% 100%
65+ 266 269 2% 10% 9% 13% 50% 5% 11% 100%
SEG
AB 278 253 1% 6% 7% 8% 60% 7% 11% 100%
C1 347 351 1% 9% 7% 8% 57% 4% 14% 100%
C2 240 239 1% 4% 10% 11% 50% 10% 15% 100%
DE 274 297 1% 6% 7% 5% 53% 11% 18% 100%
Region
London 129 161 1% 5% 5% 8% 60% 7% 13% 100%
Midlands/Wales 350 306 1% 7% 9% 8% 49% 10% 16% 100%
North 290 310 2% 5% 7% 8% 58% 8% 13% 100%
Rest of South 285 265 1% 9% 9% 8% 51% 6% 17% 100%
Scotland 85 98 7% 4% 6% 71% 6% 7% 100%
2019 General Election
Conservative Party 334 329 3% 14% 15% 15% 36% 4% 14% 100%
Labour Party 263 251 1% 3% 7% 82% 3% 4% 100%
Liberal Democrats 92 85 7% 5% 9% 62% 5% 12% 100%
2016 Brexit referendum
Leave 416 426 1% 9% 11% 10% 51% 5% 13% 100%
Remain 424 395 1% 6% 5% 8% 69% 2% 9% 100%

To what extent, if at all, do you support the planned teacher strikes?

Unweighted Weighted Strongly support Support Oppose Strongly oppose Prefer not to say Don’t know Total
Overall
National 1139 1139 23% 25% 14% 14% 9% 15% 100%
Gender
Female 590 590 22% 23% 13% 15% 10% 16% 100%
Male 549 549 24% 27% 15% 13% 6% 14% 100%
Age
18-24 82 121 30% 25% 9% 6% 21% 9% 100%
25-49 519 469 29% 26% 8% 9% 9% 19% 100%
50-64 272 280 18% 25% 22% 17% 3% 14% 100%
65+ 266 269 16% 22% 18% 25% 7% 11% 100%
SEG
AB 278 253 27% 23% 15% 17% 7% 11% 100%
C1 347 351 26% 27% 14% 13% 5% 15% 100%
C2 240 239 20% 24% 14% 17% 11% 13% 100%
DE 274 297 20% 24% 13% 11% 12% 20% 100%
Region
London 129 161 30% 28% 8% 14% 8% 13% 100%
Midlands/Wales 350 306 20% 27% 17% 12% 10% 15% 100%
North 290 310 30% 22% 11% 14% 10% 14% 100%
Rest of South 285 265 17% 24% 17% 17% 7% 18% 100%
Scotland 85 98 22% 26% 15% 15% 7% 15% 100%
2019 General Election
Conservative Party 334 329 8% 22% 24% 30% 5% 12% 100%
Labour Party 263 251 50% 34% 4% 3% 4% 5% 100%
Liberal Democrats 92 85 29% 24% 16% 11% 5% 15% 100%
2016 Brexit referendum
Leave 416 426 16% 25% 18% 23% 5% 13% 100%
Remain 424 395 39% 25% 12% 9% 4% 12% 100%

To what extent, if at all, would you support Boris Johnson returning to the cabinet?

Unweighted Weighted Strongly support Support Oppose Strongly oppose Prefer not to say Don’t know Total
Overall
National 1139 1139 7% 14% 10% 46% 7% 17% 100%
Gender
Female 590 590 6% 13% 9% 44% 8% 19% 100%
Male 549 549 7% 14% 10% 48% 7% 14% 100%
Age
18-24 82 121 5% 7% 13% 40% 21% 15% 100%
25-49 519 469 3% 11% 8% 52% 7% 19% 100%
50-64 272 280 6% 17% 9% 46% 4% 18% 100%
65+ 266 269 15% 19% 11% 36% 6% 13% 100%
SEG
AB 278 253 5% 9% 12% 54% 7% 12% 100%
C1 347 351 8% 16% 9% 50% 4% 14% 100%
C2 240 239 7% 16% 10% 38% 10% 20% 100%
DE 274 297 7% 14% 8% 40% 10% 22% 100%
Region
London 129 161 3% 8% 8% 59% 5% 16% 100%
Midlands/Wales 350 306 7% 16% 10% 40% 9% 18% 100%
North 290 310 7% 15% 9% 48% 8% 13% 100%
Rest of South 285 265 10% 14% 11% 37% 7% 21% 100%
Scotland 85 98 1% 12% 9% 60% 4% 14% 100%
2019 General Election
Conservative Party 334 329 17% 30% 12% 18% 4% 20% 100%
Labour Party 263 251 1% 4% 6% 80% 3% 6% 100%
Liberal Democrats 92 85 4% 9% 74% 1% 13% 100%
2016 Brexit referendum
Leave 416 426 15% 20% 8% 31% 6% 20% 100%
Remain 424 395 1% 10% 9% 71% 2% 8% 100%

Please indicate if you agree or disagree with the following statement: “The UK should leave the European Convention on Human Rights so that it can better control who comes in and out of the country.”

Unweighted Weighted Completely agree Somewhat agree Somewhat disagree Completely disagree Prefer not to say Don’t know Total
Overall
National 1139 1139 23% 15% 5% 27% 7% 23% 100%
Gender
Female 590 590 18% 14% 5% 23% 9% 30% 100%
Male 549 549 28% 16% 6% 30% 6% 14% 100%
Age
18-24 82 121 8% 8% 4% 38% 21% 22% 100%
25-49 519 469 11% 11% 6% 35% 8% 29% 100%
50-64 272 280 30% 22% 7% 19% 3% 20% 100%
65+ 266 269 44% 18% 3% 15% 4% 15% 100%
SEG
AB 278 253 16% 12% 9% 38% 7% 18% 100%
C1 347 351 21% 13% 6% 34% 5% 21% 100%
C2 240 239 32% 19% 4% 14% 10% 22% 100%
DE 274 297 24% 17% 3% 19% 9% 29% 100%
Region
London 129 161 18% 13% 6% 36% 7% 19% 100%
Midlands/Wales 350 306 26% 16% 6% 24% 8% 21% 100%
North 290 310 27% 13% 5% 27% 9% 19% 100%
Rest of South 285 265 21% 16% 5% 21% 6% 31% 100%
Scotland 85 98 16% 19% 3% 35% 4% 23% 100%
2019 General Election
Conservative Party 334 329 47% 21% 4% 4% 4% 19% 100%
Labour Party 263 251 10% 5% 5% 61% 3% 16% 100%
Liberal Democrats 92 85 2% 8% 12% 51% 3% 24% 100%
2016 Brexit referendum
Leave 416 426 45% 20% 3% 7% 5% 19% 100%
Remain 424 395 7% 9% 8% 55% 1% 19% 100%

Details

  • Client: GB News
  • Fieldwork Period: February 1, 2023
  • Sampling Method: Online
  • Population Sampled: All adults (18+) in Great Britain
  • Sample Size: 1,139
  • Data Collection: The data is acquired from a panel provider offering participants the chance to win money. The sampling relies on an online quota approach. Specifically, participants are sampled to meet Office of National Statistics quotas for gender, age, region, socio-economic group, vote in the 2019 general election, and vote in the 2016 Brexit referendum. No criteria are used to over- or undersample respondents. To ensure the polling is representative of the target population, we use official and reliable data sources to match the sample to demographic population targets.
  • Weighting: The sample has been weighted to be representative of the population on the following variables: gender, age, socio-economic group, region, vote in the 2019 General Elections and 2016 Brexit referendum vote.
  • Turnout Weighting for Voting Intention: To gauge the likelihood of a respondent voting in the General Elections, the poll used an 11-point scale to measure the certainty that the respondent would vote if there was an election tomorrow. The voting intention answers are then weighted by the likelihood to vote (by the numerical answer to the question divided by 10, e.g., a respondent providing a likelihood to vote of 8 out of 10 will have a weight of 0.8).
  • Margin of Error: All polls are subject to a wide range of potential sources of error. On the basis of the historical record of the polls at recent general elections, there is a 9 in 10 chance that the true value of a party’s support lies within 4 points of the estimates provided by this poll, and a 2 in 3 chance that they lie within 2 points.

GB Voting Intention (Week 4 2023)

In a new poll commissioned by GB News, we find a 29pt lead to Labour. The full tables are available here.

Selected media coverage

If there were to be a general election tomorrow, which party would you vote for?

Vote share (%)
Latest
Jan 24
Previous
Jan 18
Labour 50 45
Conservative 21 21
Lib Dem 8 9
Reform UK 7 8
SNP 6 5
Green 5 9
Other party 3 3
Plaid Cymru 1 1
Population sampled: All adults (18+) in Great Britain.
Sample sizes: 1270 (latest) and 1168 (previous).

Which of the following would be best to manage the British economy in the years ahead?

Unweighted Weighted A Conservative government with Rishi Sunak as Prime Minister A Labour government with Keir Starmer as Prime Minister Prefer not to say Don’t know Total
Overall
National 1270 1270 16% 32% 14% 38% 100%
Gender
Female 677 642 12% 30% 15% 43% 100%
Male 593 628 19% 34% 14% 33% 100%
Age
18-24 133 134 9% 35% 24% 32% 100%
25-49 537 523 8% 38% 13% 40% 100%
50-64 332 312 17% 27% 14% 42% 100%
65+ 268 300 29% 27% 12% 32% 100%
SEG
AB 292 288 17% 39% 15% 29% 100%
C1 406 398 14% 35% 13% 39% 100%
C2 262 269 16% 27% 16% 41% 100%
DE 310 315 16% 27% 14% 43% 100%
Region
London 146 179 11% 43% 13% 33% 100%
Midlands/Wales 387 341 19% 31% 15% 35% 100%
North 330 345 13% 30% 17% 40% 100%
Rest of South 303 296 20% 29% 11% 40% 100%
Scotland 104 109 10% 33% 14% 42% 100%
2019 General Election
Conservative Party 375 367 42% 12% 12% 33% 100%
Labour Party 301 285 3% 66% 10% 21% 100%
Liberal Democrats 101 98 10% 56% 5% 29% 100%
2016 Brexit referendum
Leave 484 476 29% 20% 13% 38% 100%
Remain 472 441 9% 49% 10% 31% 100%

To what extent, if at all, do you have a favourable or unfavourable opinion of Rishi Sunak?

Unweighted Weighted Very favourable Somewhat favourable Somewhat unfavourable Very unfavourable Don’t know Prefer not to say Total
Overall
National 1270 1270 2% 21% 21% 27% 18% 11% 100%
Gender
Female 677 642 2% 19% 22% 24% 21% 12% 100%
Male 593 628 3% 22% 21% 29% 15% 9% 100%
Age
18-24 133 134 1% 11% 20% 33% 16% 20% 100%
25-49 537 523 1% 14% 23% 28% 23% 11% 100%
50-64 332 312 3% 26% 21% 24% 17% 10% 100%
65+ 268 300 5% 33% 19% 24% 12% 8% 100%
SEG
AB 292 288 2% 24% 21% 28% 15% 10% 100%
C1 406 398 2% 22% 22% 27% 18% 10% 100%
C2 262 269 3% 15% 22% 30% 18% 12% 100%
DE 310 315 3% 22% 19% 23% 22% 12% 100%
Region
London 146 179 2% 20% 23% 31% 16% 7% 100%
Midlands/Wales 387 341 3% 19% 23% 26% 16% 13% 100%
North 330 345 2% 20% 14% 30% 21% 13% 100%
Rest of South 303 296 3% 26% 25% 21% 17% 8% 100%
Scotland 104 109 1% 18% 24% 26% 23% 8% 100%
2019 General Election
Conservative Party 375 367 6% 42% 16% 16% 13% 7% 100%
Labour Party 301 285 1% 10% 25% 47% 9% 8% 100%
Liberal Democrats 101 98 1% 25% 37% 29% 8% 100%
2016 Brexit referendum
Leave 484 476 5% 27% 21% 24% 14% 9% 100%
Remain 472 441 1% 20% 25% 35% 13% 7% 100%

How confident are you that the government will “level up” the country’s left behind regions by the time of the next general election?

Unweighted Weighted Completely confident Fairly confident Somewhat confident Slightly confident Not confident at all Prefer not to say Don’t know Total
Overall
National 1270 1270 1% 3% 6% 7% 60% 9% 13% 100%
Gender
Female 677 642 1% 3% 5% 6% 58% 10% 18% 100%
Male 593 628 2% 4% 6% 9% 63% 7% 9% 100%
Age
18-24 133 134 1% 3% 3% 4% 52% 18% 18% 100%
25-49 537 523 0% 1% 5% 5% 61% 10% 18% 100%
50-64 332 312 1% 3% 6% 8% 63% 7% 12% 100%
65+ 268 300 3% 9% 8% 12% 59% 4% 6% 100%
SEG
AB 292 288 2% 3% 5% 8% 63% 8% 11% 100%
C1 406 398 0% 5% 5% 6% 64% 8% 12% 100%
C2 262 269 1% 3% 7% 6% 62% 8% 13% 100%
DE 310 315 2% 2% 7% 10% 51% 10% 17% 100%
Region
London 146 179 1% 4% 5% 6% 63% 6% 14% 100%
Midlands/Wales 387 341 1% 3% 6% 10% 57% 10% 13% 100%
North 330 345 1% 3% 5% 5% 62% 11% 12% 100%
Rest of South 303 296 2% 4% 6% 8% 58% 7% 14% 100%
Scotland 104 109 1% 2% 4% 6% 66% 9% 13% 100%
2019 General Election
Conservative Party 375 367 3% 9% 10% 16% 47% 5% 10% 100%
Labour Party 301 285 1% 1% 3% 3% 79% 6% 7% 100%
Liberal Democrats 101 98 6% 5% 85% 3% 100%
2016 Brexit referendum
Leave 484 476 3% 6% 8% 9% 58% 6% 10% 100%
Remain 472 441 0% 2% 4% 7% 72% 6% 9% 100%

Please indicate if you agree or disagree with the following statement: “The British government has lost control of the country’s borders”

Unweighted Weighted Completely agree Somewhat agree Neither agree nor disagree Somewhat disagree Completely disagree Prefer not to say Don’t know Total
Overall
National 1270 1270 28% 21% 14% 9% 5% 9% 14% 100%
Gender
Female 677 642 23% 20% 14% 9% 5% 12% 18% 100%
Male 593 628 34% 22% 13% 9% 5% 7% 9% 100%
Age
18-24 133 134 18% 11% 13% 11% 11% 19% 18% 100%
25-49 537 523 20% 19% 15% 10% 6% 11% 19% 100%
50-64 332 312 37% 24% 12% 8% 2% 7% 9% 100%
65+ 268 300 39% 26% 12% 6% 6% 5% 6% 100%
SEG
AB 292 288 21% 26% 14% 12% 8% 8% 12% 100%
C1 406 398 25% 20% 18% 10% 5% 9% 13% 100%
C2 262 269 39% 20% 9% 6% 5% 9% 11% 100%
DE 310 315 31% 19% 11% 7% 3% 11% 17% 100%
Region
London 146 179 29% 21% 10% 10% 7% 8% 14% 100%
Midlands/Wales 387 341 26% 22% 12% 8% 6% 12% 13% 100%
North 330 345 35% 18% 10% 9% 5% 11% 12% 100%
Rest of South 303 296 23% 26% 19% 8% 4% 6% 14% 100%
Scotland 104 109 30% 16% 18% 9% 6% 7% 14% 100%
2019 General Election
Conservative Party 375 367 41% 26% 10% 8% 4% 5% 6% 100%
Labour Party 301 285 19% 18% 20% 13% 10% 9% 12% 100%
Liberal Democrats 101 98 16% 25% 23% 15% 7% 3% 10% 100%
2016 Brexit referendum
Leave 484 476 49% 24% 7% 5% 3% 5% 6% 100%
Remain 472 441 12% 22% 21% 13% 9% 9% 13% 100%

Details

  • Client: GB News
  • Fieldwork Period: January 24, 2023
  • Sampling Method: Online
  • Population Sampled: All adults (18+) in Great Britain
  • Sample Size: 1,270
  • Data Collection: The data is acquired from a panel provider offering participants the chance to win money. The sampling relies on an online quota approach. Specifically, participants are sampled to meet Office of National Statistics quotas for gender, age, region, socio-economic group, vote in the 2019 general election, and vote in the 2016 Brexit referendum. No criteria are used to over- or undersample respondents. To ensure the polling is representative of the target population, we use official and reliable data sources to match the sample to demographic population targets.
  • Weighting: The sample has been weighted to be representative of the population on the following variables: gender, age, socio-economic group, region, vote in the 2019 General Elections and 2016 Brexit referendum vote.
  • Turnout Weighting for Voting Intention: To gauge the likelihood of a respondent voting in the General Elections, the poll used an 11-point scale to measure the certainty that the respondent would vote if there was an election tomorrow. The voting intention answers are then weighted by the likelihood to vote (by the numerical answer to the question divided by 10, e.g., a respondent providing a likelihood to vote of 8 out of 10 will have a weight of 0.8).
  • Margin of Error: All polls are subject to a wide range of potential sources of error. On the basis of the historical record of the polls at recent general elections, there is a 9 in 10 chance that the true value of a party’s support lies within 4 points of the estimates provided by this poll, and a 2 in 3 chance that they lie within 2 points.

GB Voting Intention (Week 3 2023)

In a new poll commissioned by GB News, we find a 24pt lead to Labour. The full tables are available here.

Selected media coverage

If there were to be a general election tomorrow, which party would you vote for?

Vote share (%)
Latest
Jan 18
Previous
Jan 11
Labour 45 48
Conservative 21 21
Lib Dem 9 8
Green 9 7
Reform UK 8 7
SNP 5 5
Other party 3 3
Plaid Cymru 1 1
Population sampled: All adults (18+) in Great Britain.
Sample sizes: 1168 (latest) and 1160 (previous).

To what extent, if at all, do you trust your local police force?

Unweighted Weighted Not at all Slightly Moderately A lot Prefer not to say Don’t know Total
Overall
National 1168 1168 11% 16% 39% 18% 6% 10% 100%
Gender
Female 605 602 11% 16% 37% 15% 7% 13% 100%
Male 563 566 10% 16% 41% 20% 5% 7% 100%
Age
18-24 127 125 14% 14% 28% 12% 12% 20% 100%
25-49 489 496 11% 19% 37% 15% 8% 10% 100%
50-64 292 290 11% 14% 46% 18% 3% 9% 100%
65+ 260 257 9% 13% 41% 26% 4% 7% 100%
SEG
AB 268 271 9% 19% 38% 20% 6% 8% 100%
C1 356 357 7% 14% 45% 19% 6% 8% 100%
C2 247 242 13% 17% 36% 18% 5% 12% 100%
DE 297 298 15% 14% 35% 13% 9% 13% 100%
Region
London 130 165 15% 14% 44% 15% 4% 8% 100%
Midlands/Wales 349 314 11% 13% 39% 19% 7% 11% 100%
North 308 318 11% 13% 41% 14% 8% 12% 100%
Rest of South 283 272 10% 23% 34% 21% 5% 7% 100%
Scotland 98 100 5% 18% 37% 20% 7% 12% 100%
2019 General Election
Conservative Party 346 341 10% 13% 38% 25% 5% 8% 100%
Labour Party 272 274 11% 18% 43% 15% 5% 9% 100%
Liberal Democrats 88 91 10% 14% 43% 23% 4% 6% 100%
2016 Brexit referendum
Leave 441 434 12% 15% 41% 20% 6% 7% 100%
Remain 411 426 9% 17% 44% 20% 5% 7% 100%

The Scottish gender bill would make it easier for people to legally change their gender, for example from male to female or female to male. This includes reducing the amount of time somebody must have lived in their gender from two years to three months (or six months for 16 and 17 year olds). The UK government has suggested this would clash with existing equalities legislation in the rest of the UK. To what extent, if at all, do you support the UK government blocking the Scottish gender bill?

Unweighted Weighted Strongly support Support Neither oppose nor support Oppose Strongly oppose Prefer not to say Don’t know Total
Overall
National 1168 1168 22% 12% 19% 7% 18% 9% 13% 100%
Gender
Female 605 602 16% 13% 20% 10% 16% 11% 16% 100%
Male 563 566 29% 12% 18% 5% 20% 7% 9% 100%
Age
18-24 127 125 15% 10% 13% 6% 25% 15% 17% 100%
25-49 489 496 15% 13% 20% 7% 20% 11% 15% 100%
50-64 292 290 29% 15% 20% 8% 12% 5% 10% 100%
65+ 260 257 32% 11% 18% 8% 17% 7% 9% 100%
SEG
AB 268 271 24% 14% 18% 7% 20% 9% 8% 100%
C1 356 357 20% 15% 19% 7% 19% 8% 11% 100%
C2 247 242 27% 11% 21% 7% 13% 6% 16% 100%
DE 297 298 20% 9% 17% 9% 18% 12% 16% 100%
Region
London 130 165 17% 15% 22% 7% 22% 5% 13% 100%
Midlands/Wales 349 314 25% 14% 18% 7% 13% 10% 12% 100%
North 308 318 20% 11% 22% 7% 16% 12% 11% 100%
Rest of South 283 272 24% 13% 16% 7% 17% 8% 15% 100%
Scotland 98 100 22% 9% 15% 9% 30% 5% 9% 100%
2019 General Election
Conservative Party 346 341 42% 13% 15% 4% 12% 7% 8% 100%
Labour Party 272 274 14% 14% 19% 10% 28% 7% 9% 100%
Liberal Democrats 88 91 10% 16% 26% 10% 28% 5% 4% 100%
2016 Brexit referendum
Leave 441 434 37% 12% 16% 6% 14% 7% 9% 100%
Remain 411 426 15% 16% 21% 9% 25% 7% 8% 100%

Please indicate if you agree or disagree with the following statement: “16-year-olds are too young to change their legally recognised gender.”

Unweighted Weighted Completely agree Somewhat agree Somewhat disagree Completely disagree Prefer not to say Don’t know Total
Overall
National 1168 1168 41% 20% 9% 10% 8% 12% 100%
Gender
Female 605 602 35% 22% 10% 11% 9% 13% 100%
Male 563 566 49% 17% 8% 9% 6% 11% 100%
Age
18-24 127 125 22% 15% 9% 20% 14% 20% 100%
25-49 489 496 31% 21% 12% 13% 9% 14% 100%
50-64 292 290 51% 22% 7% 7% 4% 10% 100%
65+ 260 257 61% 18% 6% 2% 5% 8% 100%
SEG
AB 268 271 37% 22% 11% 13% 8% 8% 100%
C1 356 357 38% 21% 10% 10% 7% 14% 100%
C2 247 242 49% 22% 6% 5% 6% 12% 100%
DE 297 298 43% 15% 9% 10% 9% 15% 100%
Region
London 130 165 43% 18% 6% 16% 7% 9% 100%
Midlands/Wales 349 314 44% 21% 7% 8% 7% 13% 100%
North 308 318 39% 19% 10% 9% 11% 12% 100%
Rest of South 283 272 43% 21% 11% 7% 5% 13% 100%
Scotland 98 100 36% 16% 16% 12% 5% 14% 100%
2019 General Election
Conservative Party 346 341 64% 16% 4% 3% 4% 8% 100%
Labour Party 272 274 29% 22% 14% 19% 6% 10% 100%
Liberal Democrats 88 91 34% 26% 17% 12% 5% 6% 100%
2016 Brexit referendum
Leave 441 434 61% 16% 5% 3% 6% 8% 100%
Remain 411 426 30% 24% 14% 16% 6% 10% 100%

Please indicate if you agree or disagree with the following statement: “There is a need for stricter anti-strike laws in Britain which make it harder for people to strike.”

Unweighted Weighted Completely agree Somewhat agree Somewhat disagree Completely disagree Prefer not to say Don’t know Total
Overall
National 1168 1168 14% 19% 12% 35% 9% 13% 100%
Gender
Female 605 602 10% 17% 13% 33% 11% 16% 100%
Male 563 566 17% 21% 10% 36% 6% 9% 100%
Age
18-24 127 125 5% 10% 12% 42% 14% 17% 100%
25-49 489 496 10% 14% 10% 39% 10% 17% 100%
50-64 292 290 13% 26% 12% 36% 5% 9% 100%
65+ 260 257 26% 23% 14% 21% 7% 8% 100%
SEG
AB 268 271 14% 19% 13% 38% 9% 7% 100%
C1 356 357 14% 15% 12% 37% 8% 13% 100%
C2 247 242 15% 23% 13% 30% 8% 11% 100%
DE 297 298 12% 19% 9% 32% 9% 19% 100%
Region
London 130 165 15% 18% 9% 42% 6% 9% 100%
Midlands/Wales 349 314 13% 22% 11% 29% 9% 15% 100%
North 308 318 11% 16% 11% 38% 12% 11% 100%
Rest of South 283 272 18% 20% 14% 28% 7% 13% 100%
Scotland 98 100 6% 13% 13% 45% 6% 16% 100%
2019 General Election
Conservative Party 346 341 30% 30% 12% 11% 6% 10% 100%
Labour Party 272 274 5% 6% 11% 66% 6% 6% 100%
Liberal Democrats 88 91 14% 19% 13% 40% 5% 9% 100%
2016 Brexit referendum
Leave 441 434 25% 26% 10% 22% 7% 9% 100%
Remain 411 426 7% 13% 13% 52% 6% 9% 100%

Details

  • Client: GB News
  • Fieldwork Period: January 18, 2023
  • Sampling Method: Online
  • Population Sampled: All adults (18+) in Great Britain
  • Sample Size: 1,168
  • Data Collection: The data is acquired from a panel provider offering participants the chance to win money. The sampling relies on an online quota approach. Specifically, participants are sampled to meet Office of National Statistics quotas for gender, age, region, socio-economic group, vote in the 2019 general election, and vote in the 2016 Brexit referendum. No criteria are used to over- or undersample respondents. To ensure the polling is representative of the target population, we use official and reliable data sources to match the sample to demographic population targets.
  • Weighting: The sample has been weighted to be representative of the population on the following variables: gender, age, socio-economic group, region, vote in the 2019 General Elections and 2016 Brexit referendum vote.
  • Turnout Weighting for Voting Intention: To gauge the likelihood of a respondent voting in the General Elections, the poll used an 11-point scale to measure the certainty that the respondent would vote if there was an election tomorrow. The voting intention answers are then weighted by the likelihood to vote (by the numerical answer to the question divided by 10, e.g., a respondent providing a likelihood to vote of 8 out of 10 will have a weight of 0.8).
  • Margin of Error: All polls are subject to a wide range of potential sources of error. On the basis of the historical record of the polls at recent general elections, there is a 9 in 10 chance that the true value of a party’s support lies within 4 points of the estimates provided by this poll, and a 2 in 3 chance that they lie within 2 points.

GB Voting Intention (Week 2 2023)

In a new poll commissioned by GB News, we find a 27pt lead to Labour. The full tables are available here.

Selected media coverage

If there were to be a general election tomorrow, which party would you vote for?

Vote share (%)
Latest
Jan 11
Previous
Jan 4
Labour 48 46
Conservative 21 22
Lib Dem 8 7
Reform UK 7 8
Green 7 7
SNP 5 5
Other party 3 6
Plaid Cymru 1 1
Population sampled: All adults (18+) in Great Britain.
Sample sizes: 1160 (latest) and 1269 (previous).

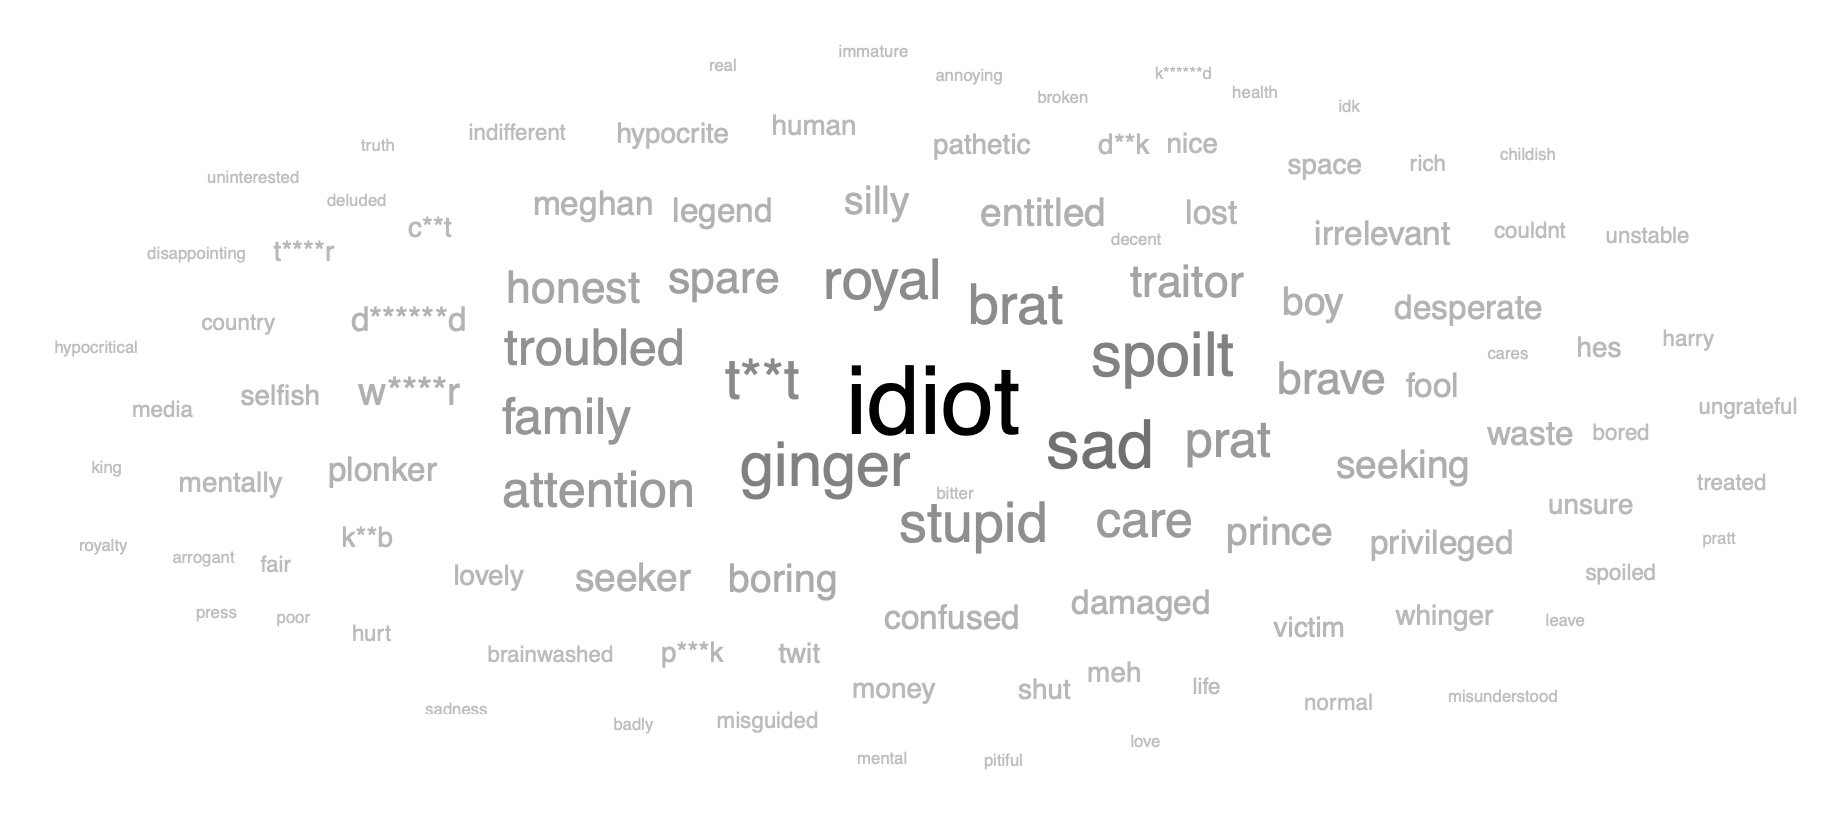
What word or phrase first comes to mind when you think about Prince Harry?

Please indicate if you agree or disagree with the following statement: “I am proud of the Royal Family.”

Unweighted Weighted Completely agree Somewhat agree Neither agree nor disagree Somewhat disagree Completely disagree Prefer not to say Don’t know Total
Overall
National 1160 1160 14% 20% 28% 10% 21% 3% 3% 100%
Gender
Female 608 603 15% 20% 29% 11% 19% 3% 3% 100%
Male 552 557 14% 20% 26% 9% 23% 4% 3% 100%
Age
18-24 134 136 4% 6% 27% 18% 34% 8% 3% 100%
25-49 484 480 8% 17% 32% 11% 23% 5% 4% 100%
50-64 291 294 15% 26% 28% 9% 18% 2% 2% 100%
65+ 251 249 31% 28% 20% 5% 12% 0% 3% 100%
SEG
AB 265 263 13% 20% 32% 10% 21% 3% 2% 100%
C1 355 352 14% 24% 27% 10% 21% 3% 1% 100%
C2 239 246 17% 19% 29% 10% 19% 3% 3% 100%
DE 301 299 14% 17% 25% 11% 22% 5% 7% 100%
Region
London 138 164 16% 20% 31% 14% 16% 2% 1% 100%
Midlands/Wales 358 312 13% 25% 26% 8% 18% 4% 5% 100%
North 299 316 14% 19% 30% 9% 22% 2% 4% 100%
Rest of South 275 270 15% 20% 28% 11% 21% 4% 2% 100%
Scotland 90 99 16% 12% 23% 12% 32% 3% 1% 100%
2019 General Election
Conservative Party 347 340 29% 34% 22% 5% 5% 2% 3% 100%
Labour Party 265 264 4% 10% 29% 15% 39% 1% 1% 100%
Liberal Democrats 88 88 18% 27% 29% 10% 12% 2% 100%
2016 Brexit referendum
Leave 441 434 23% 27% 23% 8% 13% 3% 3% 100%
Remain 405 407 10% 19% 25% 13% 30% 2% 1% 100%

The late Queen’s lady-in-waiting Lady Susan Hussey resigned after she asked a black British charity boss where she was “really” from. She has since met with the charity boss to personally apologise. Should Lady Susan Hussey be allowed to return to her work?

Unweighted Weighted Lady Susan Hussey should be allowed to return to her work Lady Susan Hussey should not be allowed to return to her work Prefer not to say Don’t know Total
Overall
National 1160 1160 42% 24% 6% 28% 100%
Gender
Female 608 603 38% 24% 5% 32% 100%
Male 552 557 46% 24% 7% 23% 100%
Age
18-24 134 136 21% 37% 9% 33% 100%
25-49 484 480 33% 25% 8% 35% 100%
50-64 291 294 49% 23% 5% 23% 100%
65+ 251 249 62% 17% 4% 17% 100%
SEG
AB 265 263 40% 25% 5% 30% 100%
C1 355 352 42% 25% 5% 27% 100%
C2 239 246 48% 19% 6% 27% 100%
DE 301 299 38% 26% 9% 27% 100%
Region
London 138 164 46% 25% 3% 26% 100%
Midlands/Wales 358 312 43% 24% 6% 27% 100%
North 299 316 42% 25% 8% 26% 100%
Rest of South 275 270 39% 21% 7% 34% 100%
Scotland 90 99 40% 32% 4% 23% 100%
2019 General Election
Conservative Party 347 340 64% 11% 6% 19% 100%
Labour Party 265 264 26% 44% 3% 27% 100%
Liberal Democrats 88 88 42% 22% 36% 100%
2016 Brexit referendum
Leave 441 434 57% 15% 7% 21% 100%
Remain 405 407 33% 36% 3% 28% 100%

Do you think it is acceptable or unacceptable for a Prime Minister to have private health insurance (which means they rely less on the National Health Service)?

Unweighted Weighted Totally acceptable Slightly acceptable Slightly unacceptable Totally unacceptable Prefer not to say Don’t know Total
Overall
National 1160 1160 41% 12% 6% 21% 5% 14% 100%
Gender
Female 608 603 39% 12% 6% 20% 5% 18% 100%
Male 552 557 44% 13% 6% 22% 6% 10% 100%
Age
18-24 134 136 25% 14% 13% 23% 8% 16% 100%
25-49 484 480 35% 13% 8% 19% 7% 19% 100%
50-64 291 294 48% 11% 5% 24% 3% 9% 100%
65+ 251 249 54% 12% 2% 22% 3% 8% 100%
SEG
AB 265 263 43% 14% 8% 22% 4% 8% 100%
C1 355 352 41% 14% 7% 20% 6% 12% 100%
C2 239 246 44% 9% 4% 23% 5% 16% 100%
DE 301 299 38% 12% 6% 19% 5% 19% 100%
Region
London 138 164 42% 20% 7% 16% 5% 10% 100%
Midlands/Wales 358 312 39% 13% 6% 19% 5% 17% 100%
North 299 316 41% 11% 5% 23% 5% 15% 100%
Rest of South 275 270 42% 10% 10% 20% 5% 13% 100%
Scotland 90 99 42% 9% 3% 31% 4% 10% 100%
2019 General Election
Conservative Party 347 340 59% 11% 3% 15% 4% 8% 100%
Labour Party 265 264 28% 15% 11% 27% 4% 14% 100%
Liberal Democrats 88 88 49% 18% 9% 10% 1% 13% 100%
2016 Brexit referendum
Leave 441 434 51% 10% 4% 21% 5% 10% 100%
Remain 405 407 40% 14% 7% 24% 4% 11% 100%

Details

  • Client: GB News
  • Fieldwork Period: January 11, 2023
  • Sampling Method: Online
  • Population Sampled: All adults (18+) in Great Britain
  • Sample Size: 1,160
  • Data Collection: The data is acquired from a panel provider offering participants the chance to win money. The sampling relies on an online quota approach. Specifically, participants are sampled to meet Office of National Statistics quotas for gender, age, region, socio-economic group, vote in the 2019 general election, and vote in the 2016 Brexit referendum. No criteria are used to over- or undersample respondents. To ensure the polling is representative of the target population, we use official and reliable data sources to match the sample to demographic population targets.
  • Weighting: The sample has been weighted to be representative of the population on the following variables: gender, age, socio-economic group, region, vote in the 2019 General Elections and 2016 Brexit referendum vote.
  • Turnout Weighting for Voting Intention: To gauge the likelihood of a respondent voting in the General Elections, the poll used an 11-point scale to measure the certainty that the respondent would vote if there was an election tomorrow. The voting intention answers are then weighted by the likelihood to vote (by the numerical answer to the question divided by 10, e.g., a respondent providing a likelihood to vote of 8 out of 10 will have a weight of 0.8).
  • Margin of Error: All polls are subject to a wide range of potential sources of error. On the basis of the historical record of the polls at recent general elections, there is a 9 in 10 chance that the true value of a party’s support lies within 4 points of the estimates provided by this poll, and a 2 in 3 chance that they lie within 2 points.

The People’s Priorities 2023

In a new poll for Policy Exchange, we asked the public what the Government must deliver in 2023. The full tables are available here.

Selected media coverage

On the list below, select the top issues you believe are most important for the government to prioritise in 2023. (Please select up to three)

Unweighted Weighted Reduce NHS waiting lists Reduce immigration by stopping the small boats crossing the Channel Make it more difficult for workers to strike Introduce tougher measures for environmental protesters who cause disruption Bring down inflation to stop the price of household goods rising Reduce people’s taxes to help with the cost of living Build more self-sufficient energy infrastructure, such as wind, solar, and nuclear Make the streets safer by cutting crime Introduce a new ban on gay and transgender conversion therapy Support Ukraine to defend itself against Russia’s invasion Improve trains and buses Revitalise town centres and high streets Make it easier for first time buyers to afford a house Prefer not to say
Overall
National 1431 1431 48% 28% 5% 8% 48% 26% 38% 13% 7% 10% 9% 6% 12% 4%
Gender
Female 742 732 50% 25% 5% 6% 50% 28% 37% 12% 5% 7% 9% 7% 13% 4%
Male 689 699 46% 32% 6% 10% 45% 24% 39% 15% 8% 13% 9% 4% 10% 3%
Age
18-24 102 152 41% 8% 3% 4% 42% 31% 29% 7% 14% 10% 14% 5% 20% 10%
25-49 634 590 44% 17% 4% 6% 55% 32% 40% 14% 8% 8% 9% 5% 15% 5%
50-64 382 351 53% 37% 6% 8% 44% 27% 37% 14% 5% 10% 8% 7% 8% 2%
65+ 313 338 55% 49% 9% 13% 42% 12% 39% 15% 3% 14% 6% 5% 7% 1%
SEG
AB 326 342 48% 19% 6% 5% 49% 22% 43% 11% 7% 10% 11% 4% 14% 5%
C1 440 437 49% 27% 6% 7% 54% 25% 39% 13% 8% 10% 10% 4% 12% 2%
C2 304 297 51% 38% 5% 11% 41% 26% 34% 18% 3% 9% 7% 7% 8% 5%
DE 361 355 45% 30% 4% 9% 44% 30% 34% 12% 6% 11% 7% 8% 12% 4%
Region
London 175 202 50% 23% 5% 7% 52% 22% 42% 16% 5% 11% 11% 3% 13% 4%
Midlands/Wales 434 384 49% 33% 6% 9% 44% 27% 38% 13% 4% 11% 7% 5% 10% 4%
North 356 389 49% 25% 3% 5% 53% 27% 37% 14% 12% 8% 9% 3% 11% 4%
Rest of South 347 333 44% 33% 9% 10% 43% 25% 39% 12% 6% 11% 9% 6% 13% 4%
Scotland 119 123 53% 22% 3% 10% 48% 26% 28% 10% 4% 12% 13% 17% 12% 3%
2019 General Election
Conservative Party 425 420 44% 53% 11% 14% 43% 20% 36% 16% 5% 11% 5% 4% 7% 1%
Labour Party 316 318 55% 7% 0% 3% 54% 25% 49% 11% 9% 9% 16% 6% 15% 3%
Liberal Democrats 117 117 53% 11% 3% 6% 52% 18% 52% 13% 4% 23% 9% 6% 9%
2016 Brexit referendum
Leave 537 531 44% 51% 8% 12% 46% 24% 34% 15% 4% 11% 4% 4% 8% 3%
Remain 516 529 57% 11% 4% 5% 50% 23% 46% 11% 9% 13% 14% 7% 12% 2%

On the list below, are there any that you strongly disagree with and think the government should definitely not do? (Please select up to three)

Unweighted Weighted Reduce NHS waiting lists Reduce immigration by stopping the small boats crossing the Channel Make it more difficult for workers to strike Introduce tougher measures for environmental protesters who cause disruption Bring down inflation to stop the price of household goods rising Reduce people’s taxes to help with the cost of living Build more self-sufficient energy infrastructure, such as wind, solar, and nuclear Make the streets safer by cutting crime Introduce a new ban on gay and transgender conversion therapy Support Ukraine to defend itself against Russia’s invasion Improve trains and buses Revitalise town centres and high streets Make it easier for first time buyers to afford a house Prefer not to say
Overall
National 1431 1431 5% 20% 36% 24% 6% 11% 6% 3% 23% 11% 4% 5% 7% 7%
Gender
Female 742 732 5% 21% 35% 22% 6% 8% 4% 2% 22% 9% 3% 4% 7% 9%
Male 689 699 5% 18% 38% 26% 7% 14% 7% 3% 23% 13% 5% 6% 8% 5%
Age
18-24 102 152 4% 27% 41% 34% 4% 10% 4% 3% 18% 9% 1% 9% 9% 17%
25-49 634 590 4% 22% 41% 25% 5% 8% 5% 2% 23% 10% 3% 3% 6% 8%
50-64 382 351 7% 16% 34% 21% 8% 13% 7% 4% 25% 15% 6% 5% 11% 5%
65+ 313 338 7% 16% 29% 21% 7% 14% 6% 2% 22% 8% 5% 6% 7% 5%
SEG
AB 326 342 4% 27% 45% 32% 6% 9% 2% 2% 21% 8% 4% 4% 6% 6%
C1 440 437 4% 20% 39% 24% 3% 10% 6% 2% 24% 9% 5% 3% 7% 8%
C2 304 297 7% 14% 32% 22% 6% 9% 4% 4% 22% 12% 5% 6% 7% 10%
DE 361 355 8% 16% 28% 19% 11% 15% 9% 3% 23% 14% 3% 9% 9% 6%
Region
London 175 202 3% 22% 41% 30% 6% 4% 6% 2% 24% 12% 3% 5% 7% 7%
Midlands/Wales 434 384 5% 16% 33% 21% 6% 11% 6% 4% 21% 12% 5% 5% 7% 9%
North 356 389 7% 21% 41% 26% 8% 14% 6% 2% 23% 8% 4% 6% 7% 6%
Rest of South 347 333 5% 19% 31% 21% 4% 10% 4% 3% 23% 11% 5% 5% 11% 7%
Scotland 119 123 7% 25% 37% 26% 10% 15% 7% 3% 23% 14% 1% 2% 4% 8%
2019 General Election
Conservative Party 425 420 5% 11% 22% 11% 5% 10% 7% 3% 23% 12% 6% 5% 9% 6%
Labour Party 316 318 4% 33% 61% 41% 4% 10% 3% 2% 25% 8% 3% 6% 6% 4%
Liberal Democrats 117 117 5% 21% 48% 34% 6% 11% 4% 1% 20% 5% 4% 4% 7% 2%
2016 Brexit referendum
Leave 537 531 6% 11% 24% 12% 6% 11% 7% 2% 21% 13% 5% 6% 11% 7%
Remain 516 529 4% 28% 53% 39% 5% 12% 4% 2% 23% 8% 4% 5% 5% 5%

On the list below, what is the one issue that is most important and the one issue that is least important for the government to prioritise in 2023? Answer: Most important

Unweighted Weighted Reduce NHS waiting lists Reduce immigration by stopping the small boats crossing the Channel Make it more difficult for workers to strike Introduce tougher measures for environmental protesters who cause disruption Bring down inflation to stop the price of household goods rising Reduce people’s taxes to help with the cost of living Build more self-sufficient energy infrastructure, such as wind, solar, and nuclear Make the streets safer by cutting crime Introduce a new ban on gay and transgender conversion therapy Support Ukraine to defend itself against Russia’s invasion Improve trains and buses Revitalise town centres and high streets Make it easier for first time buyers to afford a house Prefer not to say Total
Overall
National 1431 1431 15% 12% 3% 2% 26% 12% 15% 2% 3% 3% 1% 1% 3% 1% 100%
Gender
Female 742 732 17% 11% 4% 1% 30% 12% 13% 1% 3% 2% 2% 1% 3% 2% 100%
Male 689 699 14% 14% 2% 2% 22% 11% 18% 3% 4% 3% 1% 1% 3% 1% 100%
Age
18-24 102 152 10% 5% 2% 1% 32% 12% 17% 1% 5% 2% 3% 1% 7% 3% 100%
25-49 634 590 11% 6% 3% 2% 32% 16% 17% 2% 3% 2% 1% 1% 3% 1% 100%
50-64 382 351 17% 20% 3% 1% 20% 11% 14% 2% 5% 3% 1% 1% 2% 0% 100%
65+ 313 338 23% 20% 2% 3% 20% 6% 12% 4% 2% 3% 1% 1% 2% 1% 100%
SEG
AB 326 342 13% 7% 3% 2% 27% 9% 21% 2% 3% 2% 2% 2% 3% 2% 100%
C1 440 437 15% 12% 3% 1% 28% 13% 14% 2% 4% 3% 0% 0% 4% 1% 100%
C2 304 297 20% 16% 2% 2% 20% 13% 13% 3% 3% 4% 2% 0% 1% 1% 100%
DE 361 355 14% 15% 3% 2% 29% 12% 14% 2% 3% 2% 1% 1% 3% 1% 100%
Region
London 175 202 14% 12% 2% 26% 12% 17% 3% 6% 2% 2% 1% 2% 2% 100%
Midlands/Wales 434 384 15% 16% 3% 2% 25% 14% 12% 2% 3% 3% 1% 1% 3% 2% 100%
North 356 389 17% 11% 3% 2% 25% 11% 17% 3% 3% 3% 1% 1% 2% 1% 100%
Rest of South 347 333 13% 12% 3% 3% 26% 13% 15% 2% 3% 3% 1% 1% 4% 1% 100%
Scotland 119 123 18% 12% 2% 36% 6% 16% 2% 2% 2% 1% 4% 1% 100%
2019 General Election
Conservative Party 425 420 13% 24% 3% 3% 24% 8% 11% 2% 3% 3% 1% 2% 3% 1% 100%
Labour Party 316 318 22% 2% 2% 0% 30% 13% 17% 3% 4% 1% 1% 0% 3% 1% 100%
Liberal Democrats 117 117 18% 3% 3% 1% 28% 8% 20% 2% 3% 8% 1% 1% 3% 1% 100%
2016 Brexit referendum
Leave 537 531 14% 23% 3% 2% 24% 9% 11% 3% 3% 3% 1% 1% 2% 1% 100%
Remain 516 529 20% 3% 3% 1% 28% 12% 20% 2% 3% 3% 1% 1% 2% 1% 100%

On the list below, what is the one issue that is most important and the one issue that is least important for the government to prioritise in 2023? Answer: Least important

Unweighted Weighted Reduce NHS waiting lists Reduce immigration by stopping the small boats crossing the Channel Make it more difficult for workers to strike Introduce tougher measures for environmental protesters who cause disruption Bring down inflation to stop the price of household goods rising Reduce people’s taxes to help with the cost of living Build more self-sufficient energy infrastructure, such as wind, solar, and nuclear Make the streets safer by cutting crime Introduce a new ban on gay and transgender conversion therapy Support Ukraine to defend itself against Russia’s invasion Improve trains and buses Revitalise town centres and high streets Make it easier for first time buyers to afford a house Prefer not to say Total
Overall
National 1431 1431 2% 7% 17% 10% 3% 3% 4% 1% 23% 8% 5% 6% 6% 6% 100%
Gender
Female 742 732 2% 8% 16% 10% 2% 3% 6% 1% 22% 8% 4% 5% 4% 8% 100%
Male 689 699 2% 6% 18% 10% 3% 4% 2% 1% 23% 8% 6% 6% 7% 5% 100%
Age
18-24 102 152 2% 10% 20% 7% 3% 5% 3% 20% 9% 3% 9% 1% 8% 100%
25-49 634 590 1% 9% 19% 12% 3% 2% 3% 1% 20% 8% 5% 5% 5% 7% 100%
50-64 382 351 3% 5% 15% 8% 4% 2% 6% 1% 24% 9% 5% 4% 7% 7% 100%
65+ 313 338 3% 5% 12% 10% 2% 6% 4% 0% 26% 7% 6% 7% 7% 5% 100%
SEG
AB 326 342 2% 8% 17% 12% 2% 4% 4% 2% 18% 8% 5% 4% 6% 6% 100%
C1 440 437 2% 8% 19% 10% 3% 2% 4% 0% 23% 7% 4% 7% 6% 5% 100%
C2 304 297 1% 7% 15% 11% 2% 3% 3% 1% 27% 7% 6% 4% 5% 8% 100%
DE 361 355 3% 5% 15% 8% 2% 5% 5% 1% 22% 11% 6% 6% 5% 7% 100%
Region
London 175 202 4% 8% 17% 14% 4% 3% 4% 18% 9% 4% 4% 6% 5% 100%
Midlands/Wales 434 384 3% 5% 17% 10% 2% 2% 5% 1% 22% 8% 7% 6% 6% 5% 100%
North 356 389 1% 8% 18% 11% 3% 4% 4% 0% 23% 5% 5% 5% 4% 9% 100%
Rest of South 347 333 2% 7% 15% 9% 1% 4% 3% 2% 24% 9% 4% 7% 6% 7% 100%
Scotland 119 123 8% 18% 8% 3% 2% 2% 1% 26% 10% 5% 4% 7% 5% 100%
2019 General Election
Conservative Party 425 420 3% 4% 10% 5% 4% 3% 5% 1% 25% 10% 7% 7% 10% 5% 100%
Labour Party 316 318 1% 12% 26% 16% 2% 2% 5% 1% 18% 6% 2% 3% 3% 4% 100%
Liberal Democrats 117 117 3% 10% 20% 16% 3% 6% 1% 2% 20% 3% 5% 6% 4% 2% 100%
2016 Brexit referendum
Leave 537 531 2% 4% 11% 6% 3% 3% 5% 0% 26% 10% 8% 7% 8% 6% 100%
Remain 516 529 2% 11% 22% 16% 2% 4% 4% 1% 19% 5% 3% 4% 4% 5% 100%

Recent economic forecasts suggest the government in Britain is spending more money than it raises each year from taxation. Where should the government make savings? (Please select up to three)

Unweighted Weighted Reduce public spending on the National Health Service and social care Reduce public spending on schools Reduce public spending on science and research Reduce public spending on international aid Reduce public spending on ‘equality and diversity’ initiatives in the public sector Restrict pensions to rise in line with average earnings instead of inflation Reduce public spending on social benefits such as Universal Credit Reduce public spending on the police Reduce public spending on prisons Restrict pay rises in the public sector Reduce the defence budget Cancel the High Speed 2 rail project None of the above Prefer not to say
Overall
National 1431 1431 1% 2% 3% 46% 31% 6% 13% 2% 12% 8% 15% 46% 9% 9%
Gender
Female 742 732 1% 1% 3% 41% 25% 4% 11% 3% 13% 9% 14% 43% 10% 11%
Male 689 699 1% 2% 3% 51% 37% 7% 14% 2% 11% 8% 16% 49% 8% 6%
Age
18-24 102 152 1% 4% 4% 24% 16% 7% 13% 8% 13% 7% 25% 26% 16% 14%
25-49 634 590 1% 1% 3% 37% 19% 8% 14% 3% 14% 7% 18% 40% 10% 11%
50-64 382 351 1% 1% 4% 54% 37% 3% 12% 1% 10% 10% 14% 51% 6% 7%
65+ 313 338 1% 2% 3% 64% 51% 3% 13% 0% 8% 9% 7% 60% 6% 5%
SEG
AB 326 342 1% 3% 35% 31% 10% 14% 2% 9% 6% 18% 42% 14% 8%
C1 440 437 1% 1% 3% 47% 35% 6% 15% 3% 12% 9% 18% 48% 7% 6%
C2 304 297 0% 1% 4% 53% 31% 2% 16% 2% 12% 10% 8% 47% 5% 12%
DE 361 355 1% 3% 2% 49% 25% 4% 6% 2% 14% 8% 14% 46% 9% 10%
Region
London 175 202 1% 2% 4% 40% 34% 9% 7% 3% 6% 7% 21% 42% 14% 5%
Midlands/Wales 434 384 1% 4% 48% 32% 5% 15% 2% 10% 7% 12% 47% 9% 8%
North 356 389 1% 2% 3% 42% 29% 3% 14% 3% 13% 10% 16% 46% 9% 11%
Rest of South 347 333 1% 1% 2% 51% 34% 7% 14% 1% 13% 10% 12% 46% 6% 10%
Scotland 119 123 1% 1% 2% 44% 19% 6% 11% 5% 20% 6% 22% 47% 9% 9%
2019 General Election
Conservative Party 425 420 1% 2% 3% 71% 50% 5% 19% 1% 10% 12% 6% 52% 3% 4%
Labour Party 316 318 2% 3% 27% 15% 7% 6% 3% 10% 6% 29% 51% 13% 6%
Liberal Democrats 117 117 2% 1% 2% 28% 32% 6% 8% 1% 7% 7% 11% 52% 14% 10%
2016 Brexit referendum
Leave 537 531 1% 2% 4% 68% 49% 4% 17% 1% 11% 10% 6% 51% 4% 5%
Remain 516 529 1% 2% 2% 26% 22% 8% 8% 3% 10% 6% 24% 51% 14% 8%

Please indicate if you agree or disagree with the following statement: “The government has a clear sense of purpose.”

Unweighted Weighted Completely agree Somewhat agree Neither agree nor disagree Somewhat disagree Completely disagree Prefer not to say Don’t know Total
Overall
National 1431 1431 2% 11% 14% 19% 44% 5% 5% 100%
Gender
Female 742 732 2% 9% 15% 21% 41% 6% 6% 100%
Male 689 699 3% 14% 13% 17% 47% 4% 3% 100%
Age
18-24 102 152 5% 10% 10% 18% 41% 13% 4% 100%
25-49 634 590 2% 6% 11% 20% 49% 5% 7% 100%
50-64 382 351 3% 12% 15% 16% 49% 2% 3% 100%
65+ 313 338 3% 22% 20% 20% 31% 2% 2% 100%
SEG
AB 326 342 3% 9% 14% 17% 49% 5% 3% 100%
C1 440 437 2% 13% 12% 20% 46% 3% 4% 100%
C2 304 297 3% 14% 17% 16% 38% 7% 7% 100%
DE 361 355 3% 10% 14% 22% 40% 5% 6% 100%
Region
London 175 202 2% 9% 15% 21% 44% 5% 4% 100%
Midlands/Wales 434 384 2% 13% 13% 20% 43% 4% 5% 100%
North 356 389 3% 10% 12% 17% 46% 5% 6% 100%
Rest of South 347 333 3% 15% 16% 18% 39% 5% 4% 100%
Scotland 119 123 3% 6% 16% 16% 50% 4% 5% 100%
2019 General Election
Conservative Party 425 420 4% 24% 20% 25% 22% 3% 2% 100%
Labour Party 316 318 2% 5% 5% 14% 67% 4% 2% 100%
Liberal Democrats 117 117 6% 15% 22% 50% 2% 6% 100%
2016 Brexit referendum
Leave 537 531 3% 19% 19% 20% 34% 3% 2% 100%
Remain 516 529 3% 7% 9% 17% 56% 4% 4% 100%

Please indicate if you agree or disagree with the following statement: “The government is defending British values such as free speech.”

Unweighted Weighted Completely agree Somewhat agree Neither agree nor disagree Somewhat disagree Completely disagree Prefer not to say Don’t know Total
Overall
National 1431 1431 3% 12% 19% 19% 36% 5% 6% 100%
Gender
Female 742 732 3% 9% 20% 19% 33% 6% 9% 100%
Male 689 699 3% 14% 19% 18% 39% 3% 3% 100%
Age
18-24 102 152 2% 12% 12% 16% 40% 14% 5% 100%
25-49 634 590 1% 9% 20% 19% 38% 5% 8% 100%
50-64 382 351 6% 11% 16% 18% 41% 3% 5% 100%
65+ 313 338 5% 16% 25% 21% 24% 3% 5% 100%
SEG
AB 326 342 2% 12% 19% 19% 35% 5% 6% 100%
C1 440 437 4% 12% 20% 21% 35% 3% 5% 100%
C2 304 297 4% 10% 18% 16% 36% 7% 8% 100%
DE 361 355 4% 12% 19% 18% 36% 5% 6% 100%
Region
London 175 202 5% 13% 21% 16% 35% 4% 5% 100%
Midlands/Wales 434 384 1% 16% 17% 20% 36% 5% 4% 100%
North 356 389 3% 8% 20% 19% 36% 5% 8% 100%
Rest of South 347 333 6% 13% 18% 20% 32% 5% 7% 100%
Scotland 119 123 2% 4% 25% 16% 42% 4% 7% 100%
2019 General Election
Conservative Party 425 420 8% 23% 20% 20% 21% 3% 4% 100%
Labour Party 316 318 1% 6% 15% 15% 54% 4% 5% 100%
Liberal Democrats 117 117 1% 13% 25% 25% 28% 2% 6% 100%
2016 Brexit referendum
Leave 537 531 5% 16% 21% 20% 30% 3% 4% 100%
Remain 516 529 3% 9% 19% 17% 42% 4% 5% 100%

Please indicate if you agree or disagree with the following statement: “The government is willing to take tough decisions for the long term.”

Unweighted Weighted Completely agree Somewhat agree Neither agree nor disagree Somewhat disagree Completely disagree Prefer not to say Don’t know Total
Overall
National 1431 1431 5% 17% 16% 18% 33% 5% 6% 100%
Gender
Female 742 732 4% 15% 17% 20% 28% 7% 8% 100%
Male 689 699 6% 18% 16% 16% 38% 3% 4% 100%
Age
18-24 102 152 3% 8% 15% 15% 39% 15% 4% 100%
25-49 634 590 2% 11% 16% 20% 37% 6% 8% 100%
50-64 382 351 7% 19% 13% 19% 33% 2% 6% 100%
65+ 313 338 7% 28% 22% 14% 22% 2% 5% 100%
SEG
AB 326 342 4% 15% 17% 17% 39% 5% 3% 100%
C1 440 437 4% 19% 16% 20% 32% 4% 5% 100%
C2 304 297 6% 17% 19% 18% 26% 6% 9% 100%
DE 361 355 5% 15% 15% 17% 33% 5% 9% 100%
Region
London 175 202 5% 19% 16% 18% 34% 4% 4% 100%
Midlands/Wales 434 384 4% 20% 15% 18% 33% 5% 5% 100%
North 356 389 3% 15% 18% 18% 33% 5% 8% 100%
Rest of South 347 333 7% 17% 19% 16% 30% 5% 6% 100%
Scotland 119 123 6% 8% 14% 21% 38% 4% 8% 100%
2019 General Election
Conservative Party 425 420 11% 30% 18% 17% 18% 3% 4% 100%
Labour Party 316 318 3% 8% 13% 20% 49% 4% 4% 100%
Liberal Democrats 117 117 1% 15% 20% 18% 37% 2% 6% 100%
2016 Brexit referendum
Leave 537 531 8% 25% 17% 18% 26% 3% 4% 100%
Remain 516 529 3% 13% 15% 19% 41% 4% 4% 100%

Which of the following do you think will give the government the best chance of winning the next general election? (Please select up to three)

Unweighted Weighted Increasing economic growth Reducing inflation/cost of living Reducing immigration/the small boats Improving the National Health Service Lowering crime Helping Ukraine win the war Building new homes Lowering taxes Improving schools Stopping the strikes None of the above Prefer not to say
Overall
National 1431 1431 8% 29% 26% 44% 2% 1% 1% 7% 1% 2% 11% 8%
Gender
Female 742 732 7% 33% 21% 44% 1% 1% 1% 5% 2% 2% 10% 10%
Male 689 699 8% 24% 31% 44% 2% 2% 2% 8% 1% 2% 13% 5%
Age
18-24 102 152 10% 23% 13% 40% 5% 4% 1% 11% 1% 3% 7% 15%
25-49 634 590 8% 34% 14% 43% 2% 1% 1% 8% 2% 2% 11% 9%
50-64 382 351 6% 28% 35% 40% 1% 2% 1% 5% 1% 1% 13% 6%
65+ 313 338 6% 22% 42% 51% 1% 1% 1% 4% 2% 3% 12% 3%
SEG
AB 326 342 7% 31% 17% 45% 1% 1% 1% 6% 1% 3% 12% 7%
C1 440 437 9% 33% 25% 48% 2% 1% 0% 6% 2% 2% 10% 7%
C2 304 297 7% 22% 34% 41% 1% 1% 1% 9% 1% 1% 12% 9%
DE 361 355 7% 25% 27% 39% 2% 3% 2% 6% 1% 2% 12% 7%
Region
London 175 202 9% 29% 25% 43% 3% 1% 1% 4% 2% 2% 11% 6%
Midlands/Wales 434 384 8% 27% 29% 44% 1% 1% 1% 7% 1% 2% 11% 6%
North 356 389 8% 28% 23% 47% 2% 2% 1% 7% 2% 0% 11% 9%
Rest of South 347 333 6% 30% 27% 40% 2% 2% 2% 7% 1% 4% 11% 8%
Scotland 119 123 9% 32% 21% 41% 1% 1% 5% 2% 2% 13% 8%
2019 General Election
Conservative Party 425 420 9% 25% 49% 48% 1% 1% 1% 6% 0% 3% 3% 4%
Labour Party 316 318 6% 28% 5% 46% 3% 3% 1% 5% 2% 0% 19% 9%
Liberal Democrats 117 117 6% 29% 10% 48% 1% 3% 1% 4% 2% 3% 17% 7%
2016 Brexit referendum
Leave 537 531 7% 26% 46% 44% 1% 1% 1% 7% 1% 2% 7% 4%
Remain 516 529 8% 31% 11% 49% 2% 2% 1% 4% 1% 2% 16% 7%

Details

  • Client: Policy Exchange
  • Fieldwork Period: December 13-14, 2022
  • Sampling Method: Online
  • Population Sampled: All adults (18+) in Great Britain
  • Sample Size: 1,431
  • Data Collection: The data is acquired from a panel provider offering participants the chance to win money. The sampling relies on an online quota approach. Specifically, participants are sampled to meet Office of National Statistics quotas for gender, age, region, socio-economic group, vote in the 2019 general election, and vote in the 2016 Brexit referendum. No criteria are used to over- or undersample respondents. To ensure the polling is representative of the target population, we use official and reliable data sources to match the sample to demographic population targets.
  • Weighting: The sample has been weighted to be representative of the population on the following variables: gender, age, socio-economic group, region, vote in the 2019 General Elections and 2016 Brexit referendum vote.

GB Voting Intention (Week 1 2023)

In a new poll commissioned by GB News, we find a 24pt lead to Labour. The full tables are available here.

Selected media coverage

If there were to be a general election tomorrow, which party would you vote for?

Vote share (%)
Latest
Jan 4
Previous
Dec 28
Labour 46 45
Conservative 22 19
Reform UK 8 8
Lib Dem 7 8
Green 7 9
Other party 6 3
SNP 5 6
Plaid Cymru 1 1
Population sampled: All adults (18+) in Great Britain.
Sample sizes: 1269 (latest) and 1169 (previous).

How confident are you that the government can solve the small boats crisis?

Unweighted Weighted Completely confident Fairly confident Somewhat confident Slightly confident Not confident at all Prefer not to say Don’t know Total
Overall
National 1269 1269 1% 3% 4% 7% 57% 7% 20% 100%
Gender
Female 667 655 1% 1% 4% 7% 50% 11% 27% 100%
Male 602 614 2% 5% 4% 7% 65% 3% 14% 100%
Age
18-24 154 134 2% 2% 5% 6% 35% 15% 34% 100%
25-49 531 523 2% 1% 3% 5% 52% 10% 28% 100%
50-64 323 312 3% 4% 8% 66% 5% 14% 100%
65+ 261 300 2% 8% 5% 10% 66% 3% 8% 100%
SEG
AB 316 281 3% 4% 4% 7% 55% 6% 22% 100%
C1 385 391 2% 3% 4% 6% 57% 7% 23% 100%
C2 258 266 1% 4% 5% 7% 56% 10% 17% 100%
DE 310 331 1% 3% 3% 9% 59% 7% 19% 100%
Region
London 141 179 2% 4% 2% 9% 52% 7% 24% 100%
Midlands/Wales 387 341 1% 4% 6% 7% 54% 10% 17% 100%
North 332 345 2% 3% 3% 5% 60% 8% 20% 100%
Rest of South 303 295 1% 3% 3% 9% 58% 5% 20% 100%
Scotland 106 109 3% 1% 6% 61% 4% 25% 100%
2019 General Election
Conservative Party 360 360 3% 10% 7% 14% 52% 3% 12% 100%
Labour Party 294 284 1% 1% 2% 4% 72% 4% 16% 100%
Liberal Democrats 96 98 1% 3% 2% 73% 3% 19% 100%
2016 Brexit referendum
Leave 460 470 2% 6% 4% 10% 61% 5% 12% 100%
Remain 453 460 1% 1% 3% 5% 63% 5% 21% 100%

To what extent, if at all, do you have a favourable or unfavourable opinion of Keir Starmer?

Unweighted Weighted Very favourable Somewhat favourable Somewhat unfavourable Very unfavourable Don’t know Prefer not to say Total
Overall
National 1269 1269 6% 24% 19% 20% 22% 9% 100%
Gender
Female 667 655 5% 22% 17% 17% 27% 13% 100%
Male 602 614 6% 27% 20% 24% 17% 5% 100%
Age
18-24 154 134 5% 25% 13% 14% 26% 17% 100%
25-49 531 523 6% 28% 16% 12% 28% 10% 100%
50-64 323 312 5% 20% 22% 25% 20% 7% 100%
65+ 261 300 6% 22% 22% 33% 12% 4% 100%
SEG
AB 316 281 8% 30% 16% 18% 19% 8% 100%
C1 385 391 4% 29% 20% 19% 21% 7% 100%
C2 258 266 5% 16% 19% 24% 23% 13% 100%
DE 310 331 6% 20% 18% 21% 26% 8% 100%
Region
London 141 179 8% 37% 14% 15% 18% 8% 100%
Midlands/Wales 387 341 4% 23% 19% 21% 22% 11% 100%
North 332 345 6% 23% 18% 21% 25% 8% 100%
Rest of South 303 295 6% 20% 19% 23% 23% 9% 100%
Scotland 106 109 5% 25% 25% 19% 20% 5% 100%
2019 General Election
Conservative Party 360 360 3% 12% 26% 44% 11% 4% 100%
Labour Party 294 284 12% 46% 17% 7% 12% 5% 100%
Liberal Democrats 96 98 9% 43% 17% 4% 21% 6% 100%
2016 Brexit referendum
Leave 460 470 4% 15% 23% 37% 16% 6% 100%
Remain 453 460 8% 40% 19% 9% 17% 6% 100%

How has your opinion of Prince Harry changed over the last year?

Unweighted Weighted It has become more unfavourable It has become more favourable It has not changed at all Don’t know Prefer not to say Total
Overall
National 1269 1269 38% 9% 36% 10% 7% 100%
Gender
Female 667 655 36% 11% 32% 11% 10% 100%
Male 602 614 40% 7% 41% 9% 3% 100%
Age
18-24 154 134 23% 10% 37% 15% 15% 100%
25-49 531 523 26% 13% 39% 12% 9% 100%
50-64 323 312 43% 7% 37% 9% 4% 100%
65+ 261 300 58% 3% 31% 5% 3% 100%
SEG
AB 316 281 39% 11% 35% 9% 6% 100%
C1 385 391 35% 10% 41% 10% 5% 100%
C2 258 266 40% 5% 34% 11% 10% 100%
DE 310 331 37% 10% 34% 10% 8% 100%
Region
London 141 179 35% 10% 35% 12% 8% 100%
Midlands/Wales 387 341 40% 6% 37% 8% 9% 100%
North 332 345 36% 12% 35% 11% 7% 100%
Rest of South 303 295 39% 9% 35% 10% 7% 100%
Scotland 106 109 37% 9% 43% 8% 3% 100%
2019 General Election
Conservative Party 360 360 68% 2% 22% 5% 3% 100%
Labour Party 294 284 24% 20% 45% 9% 3% 100%
Liberal Democrats 96 98 33% 7% 47% 9% 4% 100%
2016 Brexit referendum
Leave 460 470 56% 5% 27% 7% 5% 100%
Remain 453 460 30% 15% 43% 7% 4% 100%

[Sample A] To re-join the European Union in the future the UK would need to re-join the single market, join the Schengen Area, accept the free movement of EU nationals, apply EU laws, and pay into the EU budget in proportion to the size of the UK economy. If there were a referendum on Britain’s membership of the European Union, how would you vote?

Unweighted Weighted Join the European Union Stay out of the European Union Prefer not to say Don’t know Total
Overall
National 623 621 38% 35% 7% 20% 100%
Gender
Female 326 317 36% 30% 10% 25% 100%
Male 297 304 40% 41% 4% 15% 100%
Age
18-24 74 63 48% 18% 15% 20% 100%
25-49 267 260 46% 23% 10% 21% 100%
50-64 155 150 31% 40% 4% 26% 100%
65+ 127 148 26% 59% 3% 13% 100%
SEG
AB 151 137 47% 29% 5% 19% 100%
C1 191 190 48% 30% 5% 16% 100%
C2 131 133 21% 48% 11% 20% 100%
DE 150 161 30% 36% 9% 26% 100%
Region
London 72 91 44% 36% 6% 14% 100%
Midlands/Wales 189 165 30% 40% 8% 22% 100%
North 164 170 31% 35% 10% 25% 100%
Rest of South 146 141 45% 32% 6% 17% 100%
Scotland 52 54 51% 32% 2% 15% 100%
2019 General Election
Conservative Party 181 184 11% 72% 3% 14% 100%
Labour Party 144 137 71% 15% 3% 11% 100%
Liberal Democrats 47 49 71% 12% 17% 100%
2016 Brexit referendum
Leave 228 232 9% 72% 5% 14% 100%
Remain 216 221 72% 11% 3% 14% 100%

[Sample B] If there were a referendum on Britain’s membership of the European Union, how would you vote?

Unweighted Weighted Join the European Union Stay out of the European Union Prefer not to say Don’t know Total
Overall
National 646 648 42% 33% 7% 19% 100%
Gender
Female 341 338 46% 23% 10% 22% 100%
Male 305 310 37% 44% 3% 16% 100%
Age
18-24 80 71 58% 11% 12% 18% 100%
25-49 264 263 54% 18% 7% 21% 100%
50-64 168 162 33% 44% 4% 18% 100%
65+ 134 152 22% 56% 5% 17% 100%
SEG
AB 165 144 54% 26% 6% 13% 100%
C1 194 201 47% 30% 6% 17% 100%
C2 127 133 30% 39% 8% 23% 100%
DE 160 170 34% 38% 6% 22% 100%
Region
London 69 88 51% 22% 10% 16% 100%
Midlands/Wales 198 176 40% 36% 8% 16% 100%
North 168 175 41% 36% 5% 19% 100%
Rest of South 157 154 36% 35% 6% 24% 100%
Scotland 54 55 52% 23% 3% 21% 100%
2019 General Election
Conservative Party 179 177 12% 72% 2% 14% 100%
Labour Party 150 146 76% 10% 2% 12% 100%
Liberal Democrats 49 49 72% 14% 6% 8% 100%
2016 Brexit referendum
Leave 232 239 8% 73% 5% 14% 100%
Remain 237 239 79% 7% 3% 11% 100%

Details

  • Client: GB News
  • Fieldwork Period: January 4, 2023
  • Sampling Method: Online
  • Population Sampled: All adults (18+) in Great Britain
  • Sample Size: 1,269
  • Data Collection: The data is acquired from a panel provider offering participants the chance to win money. The sampling relies on an online quota approach. Specifically, participants are sampled to meet Office of National Statistics quotas for gender, age, region, socio-economic group, vote in the 2019 general election, and vote in the 2016 Brexit referendum. No criteria are used to over- or undersample respondents. To ensure the polling is representative of the target population, we use official and reliable data sources to match the sample to demographic population targets.
  • Weighting: The sample has been weighted to be representative of the population on the following variables: gender, age, socio-economic group, region, vote in the 2019 General Elections and 2016 Brexit referendum vote.
  • Turnout Weighting for Voting Intention: To gauge the likelihood of a respondent voting in the General Elections, the poll used an 11-point scale to measure the certainty that the respondent would vote if there was an election tomorrow. The voting intention answers are then weighted by the likelihood to vote (by the numerical answer to the question divided by 10, e.g., a respondent providing a likelihood to vote of 8 out of 10 will have a weight of 0.8).
  • Margin of Error: All polls are subject to a wide range of potential sources of error. On the basis of the historical record of the polls at recent general elections, there is a 9 in 10 chance that the true value of a party’s support lies within 4 points of the estimates provided by this poll, and a 2 in 3 chance that they lie within 2 points.

GB Voting Intention (Week 52 2022)

In a new poll commissioned by GB News, we find a 26pt lead to Labour. The full tables are available here.

Selected media coverage

If there were to be a general election tomorrow, which party would you vote for?

Vote share (%)
Latest
Dec 28
Previous
Dec 21
Labour 45 46
Conservative 19 22
Green 9 6
Lib Dem 8 8
Reform UK 8 8
SNP 6 5
Other party 3 3
Plaid Cymru 1 1
Population sampled: All adults (18+) in Great Britain.
Sample sizes: 1169 (latest) and 1148 (previous).

How confident are you that the government can reduce the cost of living in 2023?

Unweighted Weighted Completely confident Fairly confident Somewhat confident Slightly confident Not confident at all Prefer not to say Don’t know Total
Overall
National 1169 1169 1% 3% 5% 10% 70% 3% 7% 100%
Gender
Female 607 599 1% 1% 5% 9% 71% 3% 9% 100%
Male 562 570 1% 5% 4% 12% 69% 3% 6% 100%
Age
18-24 141 124 1% 1% 5% 9% 72% 6% 7% 100%
25-49 491 482 1% 2% 2% 9% 73% 4% 9% 100%
50-64 303 287 0% 3% 7% 11% 68% 4% 7% 100%
65+ 234 276 2% 8% 7% 12% 66% 0% 5% 100%
SEG
AB 284 286 1% 4% 3% 13% 71% 2% 6% 100%
C1 361 357 3% 5% 10% 73% 3% 7% 100%
C2 240 237 3% 3% 5% 9% 68% 6% 5% 100%
DE 284 290 1% 3% 5% 10% 67% 3% 11% 100%
Region
London 134 165 5% 3% 16% 65% 3% 7% 100%
Midlands/Wales 369 314 1% 3% 5% 9% 70% 3% 9% 100%
North 288 318 0% 4% 5% 7% 72% 3% 7% 100%
Rest of South 284 272 2% 3% 5% 13% 66% 5% 7% 100%
Scotland 94 100 1% 3% 6% 83% 2% 5% 100%
2019 General Election
Conservative Party 349 340 2% 9% 11% 15% 53% 2% 7% 100%
Labour Party 269 261 0% 1% 3% 90% 1% 4% 100%
Liberal Democrats 93 91 1% 1% 13% 82% 3% 100%
2016 Brexit referendum
Leave 453 438 2% 6% 8% 12% 64% 2% 6% 100%
Remain 421 406 0% 2% 2% 8% 82% 2% 3% 100%

Thinking about your own and your family’s financial situation, do you think 2023 will be better or worse than 2022?

Unweighted Weighted 2023 will be better 2023 will be worse 2023 will be the same Prefer not to say Don’t know Total
Overall
National 1169 1169 6% 60% 20% 3% 11% 100%
Gender
Female 607 599 4% 62% 17% 4% 12% 100%
Male 562 570 7% 57% 23% 3% 9% 100%
Age
18-24 141 124 4% 53% 19% 6% 19% 100%
25-49 491 482 7% 61% 16% 4% 12% 100%
50-64 303 287 5% 61% 23% 3% 8% 100%
65+ 234 276 5% 59% 25% 2% 9% 100%
SEG
AB 284 286 9% 60% 20% 3% 9% 100%
C1 361 357 5% 61% 20% 4% 11% 100%
C2 240 237 6% 57% 21% 6% 10% 100%
DE 284 290 5% 60% 20% 2% 13% 100%
Region
London 134 165 7% 52% 30% 4% 8% 100%
Midlands/Wales 369 314 7% 59% 19% 2% 12% 100%
North 288 318 5% 64% 15% 4% 12% 100%
Rest of South 284 272 5% 56% 24% 5% 10% 100%
Scotland 94 100 2% 71% 17% 2% 8% 100%
2019 General Election
Conservative Party 349 340 10% 51% 28% 3% 8% 100%
Labour Party 269 261 4% 65% 20% 1% 10% 100%
Liberal Democrats 93 91 3% 65% 25% 1% 6% 100%
2016 Brexit referendum
Leave 453 438 7% 55% 26% 3% 9% 100%
Remain 421 406 5% 69% 17% 2% 7% 100%

Members of the Scottish Parliament recently approved plans to make it easier for people to legally change their gender, for example from male to female or female to male. This includes reducing the amount of time somebody must have lived in their gender from two years to three months (or six months for 16 and 17 year olds) and removing the need for somebody to receive a medical diagnosis of gender dysphoria. To what extent, if at all, do you support or oppose these changes being applied to the rest of the UK?

Unweighted Weighted Strongly support Support Neither oppose nor support Oppose Strongly oppose Prefer not to say Don’t know Total
Overall
National 1169 1169 11% 9% 23% 9% 28% 6% 14% 100%
Gender
Female 607 599 13% 9% 24% 9% 23% 7% 16% 100%
Male 562 570 10% 8% 23% 10% 33% 5% 11% 100%
Age
18-24 141 124 24% 12% 21% 8% 14% 7% 15% 100%
25-49 491 482 15% 11% 23% 10% 20% 6% 15% 100%
50-64 303 287 8% 7% 25% 9% 31% 5% 14% 100%
65+ 234 276 3% 5% 22% 8% 45% 6% 11% 100%
SEG
AB 284 286 13% 11% 24% 10% 25% 4% 13% 100%
C1 361 357 14% 9% 22% 10% 29% 5% 12% 100%
C2 240 237 6% 7% 27% 9% 30% 8% 13% 100%
DE 284 290 10% 8% 22% 7% 27% 7% 18% 100%
Region
London 134 165 13% 14% 15% 7% 31% 5% 14% 100%
Midlands/Wales 369 314 10% 7% 23% 11% 28% 5% 16% 100%
North 288 318 13% 7% 26% 8% 24% 7% 15% 100%
Rest of South 284 272 10% 9% 22% 9% 31% 8% 11% 100%
Scotland 94 100 11% 8% 31% 13% 25% 5% 7% 100%
2019 General Election
Conservative Party 349 340 3% 5% 19% 11% 50% 4% 8% 100%
Labour Party 269 261 23% 17% 21% 9% 12% 4% 13% 100%
Liberal Democrats 93 91 15% 9% 29% 12% 20% 3% 13% 100%
2016 Brexit referendum
Leave 453 438 3% 7% 21% 10% 46% 4% 9% 100%
Remain 421 406 21% 11% 24% 10% 17% 4% 14% 100%

Details

  • Client: GB News
  • Fieldwork Period: December 28, 2022
  • Sampling Method: Online
  • Population Sampled: All adults (18+) in Great Britain
  • Sample Size: 1,169
  • Data Collection: The data is acquired from a panel provider offering participants the chance to win money. The sampling relies on an online quota approach. Specifically, participants are sampled to meet Office of National Statistics quotas for gender, age, region, socio-economic group, vote in the 2019 general election, and vote in the 2016 Brexit referendum. No criteria are used to over- or undersample respondents. To ensure the polling is representative of the target population, we use official and reliable data sources to match the sample to demographic population targets.
  • Weighting: The sample has been weighted to be representative of the population on the following variables: gender, age, socio-economic group, region, vote in the 2019 General Elections and 2016 Brexit referendum vote.
  • Turnout Weighting for Voting Intention: To gauge the likelihood of a respondent voting in the General Elections, the poll used an 11-point scale to measure the certainty that the respondent would vote if there was an election tomorrow. The voting intention answers are then weighted by the likelihood to vote (by the numerical answer to the question divided by 10, e.g., a respondent providing a likelihood to vote of 8 out of 10 will have a weight of 0.8).
  • Margin of Error: All polls are subject to a wide range of potential sources of error. On the basis of the historical record of the polls at recent general elections, there is a 9 in 10 chance that the true value of a party’s support lies within 4 points of the estimates provided by this poll, and a 2 in 3 chance that they lie within 2 points.

GB Voting Intention (Week 51 2022)

In a new poll commissioned by GB News, we find a 24pt lead to Labour. The full tables are available here.

Selected media coverage

If there were to be a general election tomorrow, which party would you vote for?

Vote share (%)
Latest
Dec 21
Previous
Dec 14
Labour 46 45
Conservative 22 24
Lib Dem 8 7
Reform UK 8 7
Green 6 6
SNP 5 5
Other party 3 4
Plaid Cymru 1 1
Population sampled: All adults (18+) in Great Britain.
Sample sizes: 1148 (latest) and 1151 (previous).

This week, the High Court concluded that it is lawful for the government to make arrangements for relocating asylum seekers to Rwanda and for their asylum claims to be determined in Rwanda rather than in the United Kingdom. To what extent, if at all, do you support the government to make arrangements for relocating asylum seekers to Rwanda rather than Britain?

Unweighted Weighted Strongly support Support Neither oppose nor support Oppose Strongly oppose Prefer not to say Don’t know Total
Overall
National 1148 1148 27% 13% 12% 8% 21% 6% 12% 100%
Gender
Female 607 599 20% 12% 13% 9% 21% 8% 17% 100%
Male 541 549 35% 14% 11% 8% 21% 4% 6% 100%
Age
18-24 124 122 11% 6% 10% 15% 25% 16% 17% 100%
25-49 500 473 17% 9% 13% 9% 28% 7% 17% 100%
50-64 294 282 34% 17% 13% 9% 14% 6% 7% 100%
65+ 230 271 47% 19% 9% 3% 16% 1% 5% 100%
SEG
AB 281 278 18% 11% 10% 11% 34% 5% 12% 100%
C1 351 344 25% 15% 11% 10% 24% 6% 10% 100%
C2 230 239 39% 15% 16% 4% 7% 7% 12% 100%
DE 286 286 30% 12% 13% 6% 18% 7% 14% 100%
Region
London 134 162 20% 11% 11% 10% 32% 4% 12% 100%
Midlands/Wales 348 308 32% 13% 12% 8% 15% 7% 12% 100%
North 287 312 29% 17% 12% 9% 17% 6% 10% 100%
Rest of South 285 267 24% 13% 12% 6% 24% 6% 14% 100%
Scotland 94 98 26% 9% 10% 7% 30% 8% 10% 100%
2019 General Election
Conservative Party 338 337 52% 21% 12% 3% 3% 3% 6% 100%
Labour Party 270 248 10% 7% 11% 12% 48% 4% 8% 100%
Liberal Democrats 100 89 8% 14% 11% 14% 42% 1% 9% 100%
2016 Brexit referendum
Leave 423 430 49% 17% 13% 4% 6% 4% 7% 100%
Remain 437 398 10% 10% 12% 13% 43% 3% 9% 100%

Please indicate if you agree or disagree with the following statement: “Nothing in Britain works anymore.”

Unweighted Weighted Completely agree Somewhat agree Neither agree nor disagree Somewhat disagree Completely disagree Prefer not to say Don’t know Total
Overall
National 1148 1148 18% 39% 14% 14% 5% 5% 5% 100%
Gender
Female 607 599 18% 40% 13% 13% 3% 7% 6% 100%
Male 541 549 18% 38% 15% 15% 7% 4% 4% 100%
Age
18-24 124 122 16% 35% 13% 9% 2% 14% 10% 100%
25-49 500 473 17% 41% 12% 12% 3% 7% 8% 100%
50-64 294 282 19% 42% 13% 17% 4% 3% 2% 100%
65+ 230 271 20% 35% 17% 17% 8% 1% 1% 100%
SEG
AB 281 278 15% 41% 15% 16% 6% 4% 4% 100%
C1 351 344 18% 34% 14% 19% 5% 5% 4% 100%
C2 230 239 19% 39% 14% 10% 4% 7% 7% 100%
DE 286 286 19% 45% 12% 10% 3% 5% 6% 100%
Region
London 134 162 14% 40% 18% 16% 4% 2% 6% 100%
Midlands/Wales 348 308 19% 35% 15% 14% 6% 6% 5% 100%
North 287 312 18% 43% 11% 14% 4% 6% 4% 100%
Rest of South 285 267 18% 43% 12% 13% 4% 5% 5% 100%
Scotland 94 98 21% 31% 15% 15% 6% 6% 6% 100%
2019 General Election
Conservative Party 338 337 13% 37% 19% 18% 9% 2% 3% 100%
Labour Party 270 248 24% 43% 11% 14% 3% 2% 2% 100%
Liberal Democrats 100 89 11% 54% 10% 17% 3% 4% 1% 100%
2016 Brexit referendum
Leave 423 430 19% 39% 16% 14% 5% 4% 3% 100%
Remain 437 398 18% 42% 12% 17% 5% 3% 3% 100%

Which of the following do you think would best manage the strikes as Prime Minister?

Unweighted Weighted Rishi Sunak Keir Starmer None of them Prefer not to say Don’t know Total
Overall
National 1148 1148 14% 22% 40% 6% 18% 100%
Gender
Female 607 599 11% 20% 39% 7% 23% 100%
Male 541 549 16% 25% 41% 5% 13% 100%
Age
18-24 124 122 5% 31% 36% 13% 15% 100%
25-49 500 473 10% 24% 38% 7% 22% 100%
50-64 294 282 16% 20% 42% 5% 18% 100%
65+ 230 271 22% 20% 44% 2% 13% 100%
SEG
AB 281 278 13% 29% 36% 5% 17% 100%
C1 351 344 14% 23% 43% 5% 15% 100%
C2 230 239 17% 15% 40% 7% 20% 100%
DE 286 286 11% 21% 41% 6% 21% 100%
Region
London 134 162 14% 27% 38% 5% 16% 100%
Midlands/Wales 348 308 16% 19% 39% 6% 20% 100%
North 287 312 14% 23% 37% 6% 20% 100%
Rest of South 285 267 13% 25% 43% 5% 15% 100%
Scotland 94 98 7% 16% 51% 8% 19% 100%
2019 General Election
Conservative Party 338 337 35% 5% 43% 4% 13% 100%
Labour Party 270 248 2% 50% 32% 3% 14% 100%
Liberal Democrats 100 89 4% 35% 38% 5% 18% 100%
2016 Brexit referendum
Leave 423 430 23% 14% 46% 3% 14% 100%
Remain 437 398 9% 36% 36% 5% 15% 100%

There have been three prime ministers in the United Kingdom in 2022. On the list below, who do you think have been the most and least competent Prime Minister? Most competent

Unweighted Weighted Boris Johnson Liz Truss Rishi Sunak Prefer not to say Don’t know Total
Overall
National 1148 1148 32% 3% 29% 11% 25% 100%
Gender
Female 607 599 29% 3% 28% 13% 27% 100%
Male 541 549 35% 3% 29% 9% 23% 100%
Age
18-24 124 122 24% 2% 32% 12% 30% 100%
25-49 500 473 24% 3% 27% 16% 30% 100%
50-64 294 282 36% 2% 28% 9% 26% 100%
65+ 230 271 45% 4% 31% 6% 14% 100%
SEG
AB 281 278 26% 4% 32% 10% 28% 100%
C1 351 344 30% 2% 32% 9% 28% 100%
C2 230 239 40% 4% 25% 15% 17% 100%
DE 286 286 33% 3% 25% 13% 26% 100%
Region
London 134 162 24% 3% 34% 9% 30% 100%
Midlands/Wales 348 308 34% 3% 28% 11% 24% 100%
North 287 312 33% 1% 31% 11% 22% 100%
Rest of South 285 267 36% 5% 23% 10% 26% 100%
Scotland 94 98 20% 4% 29% 21% 26% 100%
2019 General Election
Conservative Party 338 337 62% 4% 22% 3% 9% 100%
Labour Party 270 248 17% 2% 37% 12% 32% 100%
Liberal Democrats 100 89 10% 2% 45% 13% 30% 100%
2016 Brexit referendum
Leave 423 430 53% 3% 21% 8% 16% 100%
Remain 437 398 16% 2% 38% 12% 32% 100%

There have been three prime ministers in the United Kingdom in 2022. On the list below, who do you think have been the most and least competent Prime Minister? Least competent

Unweighted Weighted Boris Johnson Liz Truss Rishi Sunak Prefer not to say Don’t know Total
Overall
National 1148 1148 14% 63% 6% 6% 11% 100%
Gender
Female 607 599 16% 61% 4% 6% 13% 100%
Male 541 549 12% 65% 8% 6% 9% 100%
Age
18-24 124 122 19% 50% 4% 13% 13% 100%
25-49 500 473 18% 55% 4% 7% 16% 100%
50-64 294 282 9% 70% 10% 7% 4% 100%
65+ 230 271 10% 74% 6% 1% 8% 100%
SEG
AB 281 278 18% 62% 6% 5% 10% 100%
C1 351 344 16% 65% 5% 5% 8% 100%
C2 230 239 12% 61% 7% 6% 14% 100%
DE 286 286 10% 63% 6% 9% 13% 100%
Region
London 134 162 16% 63% 8% 6% 7% 100%
Midlands/Wales 348 308 15% 62% 5% 8% 10% 100%
North 287 312 11% 66% 8% 5% 11% 100%
Rest of South 285 267 16% 62% 5% 5% 12% 100%
Scotland 94 98 14% 56% 7% 6% 17% 100%
2019 General Election
Conservative Party 338 337 4% 77% 10% 2% 7% 100%
Labour Party 270 248 25% 61% 3% 5% 6% 100%
Liberal Democrats 100 89 22% 69% 3% 2% 5% 100%
2016 Brexit referendum
Leave 423 430 8% 70% 9% 4% 9% 100%
Remain 437 398 24% 63% 2% 4% 8% 100%

Details

  • Client: GB News
  • Fieldwork Period: December 21, 2022
  • Sampling Method: Online
  • Population Sampled: All adults (18+) in Great Britain
  • Sample Size: 1,148
  • Data Collection: The data is acquired from a panel provider offering participants the chance to win money. The sampling relies on an online quota approach. Specifically, participants are sampled to meet Office of National Statistics quotas for gender, age, region, socio-economic group, vote in the 2019 general election, and vote in the 2016 Brexit referendum. No criteria are used to over- or undersample respondents. To ensure the polling is representative of the target population, we use official and reliable data sources to match the sample to demographic population targets.
  • Weighting: The sample has been weighted to be representative of the population on the following variables: gender, age, socio-economic group, region, vote in the 2019 General Elections and 2016 Brexit referendum vote.
  • Turnout Weighting for Voting Intention: To gauge the likelihood of a respondent voting in the General Elections, the poll used an 11-point scale to measure the certainty that the respondent would vote if there was an election tomorrow. The voting intention answers are then weighted by the likelihood to vote (by the numerical answer to the question divided by 10, e.g., a respondent providing a likelihood to vote of 8 out of 10 will have a weight of 0.8).
  • Margin of Error: All polls are subject to a wide range of potential sources of error. On the basis of the historical record of the polls at recent general elections, there is a 9 in 10 chance that the true value of a party’s support lies within 4 points of the estimates provided by this poll, and a 2 in 3 chance that they lie within 2 points.